
Fishery
13. Jul 2020
New method for registering fish catch statistics – all details now included
Statistics Faroe Islands has been publishing fish catch statistics for many years. Up to now, the information has been confined to fresh fish, based on the volume of ice-covered fish for on-land processing. Details of pelagic fish and fish from filleting factory trawlers were not included in these statistics.
As an increasing number of fishing vessels are now equipped with onboard processing facilities, all fish catches, regardless of processing method, will now be included in the statistics. This change should be kept in mind when comparing volume and price over time.
The new system also allows users to select fishing grounds and international convention areas (NEAFC and NAFO). Later this year, users will also be able to select ship categories. The addition of details on fishing grounds, processing equipment and ship categories gives a significantly clearer picture of the catches – e.g. whether the fish is ice-covered, frozen or filleted.
This is the first survey using the new method. There may be a certain degree of variance between the old and the new method, but the system is under continual development. All figures have been updated retrospectively.
The new system currently dates back to 2015; however, upcoming surveys will date further back. New tables will also be added, which will make it even easier to follow the trend in fish catches.
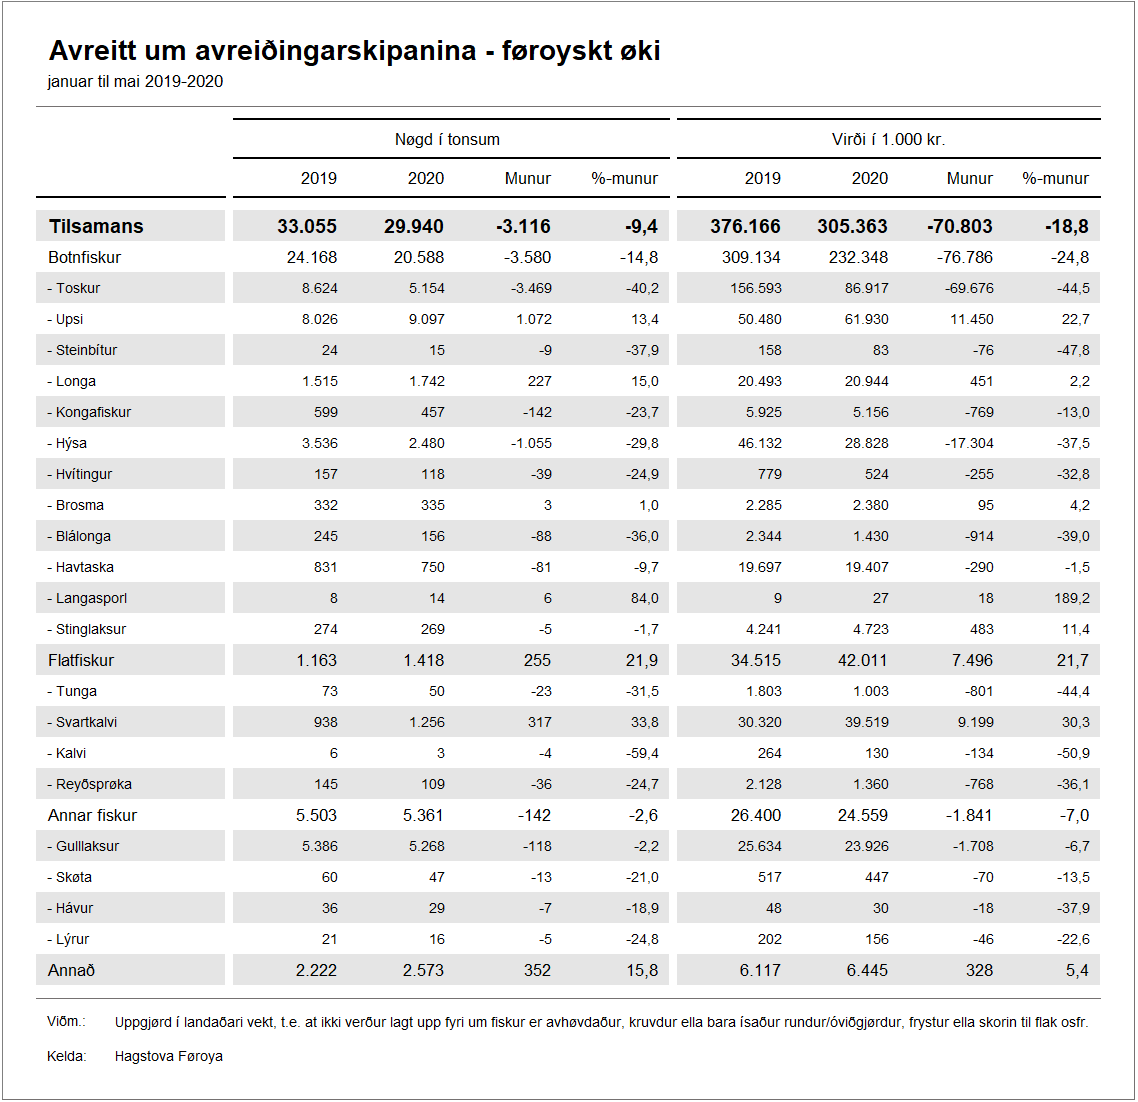
Below are two examples from the new system. The first table shows selected fish types, excluding pelagic fish, caught in Faroese waters. Comparisons are made for volume and value for the first five months of this year compared to the same period last year. The table shows, for example, that significantly lower volumes of cod and haddock were caught in Faroese waters this year, while saithe catches were much higher this year than in 2019.
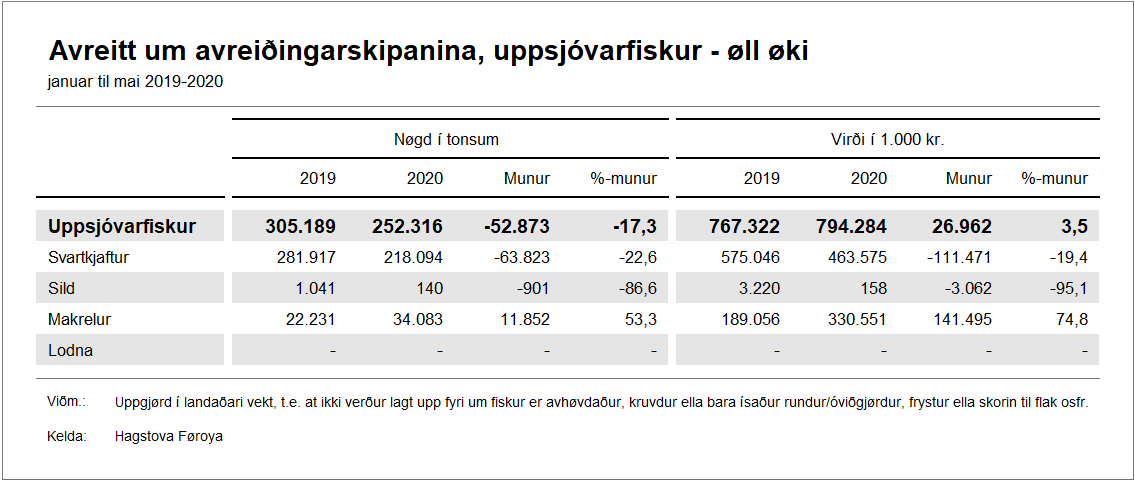
The second table shows sales of pelagic fish caught in all areas in the first five months of this year compared to the same period last year.
Both old and new tables are available in the statbank