
Population
Population above 55,600 on 1 October — up 1.6% year-on-year
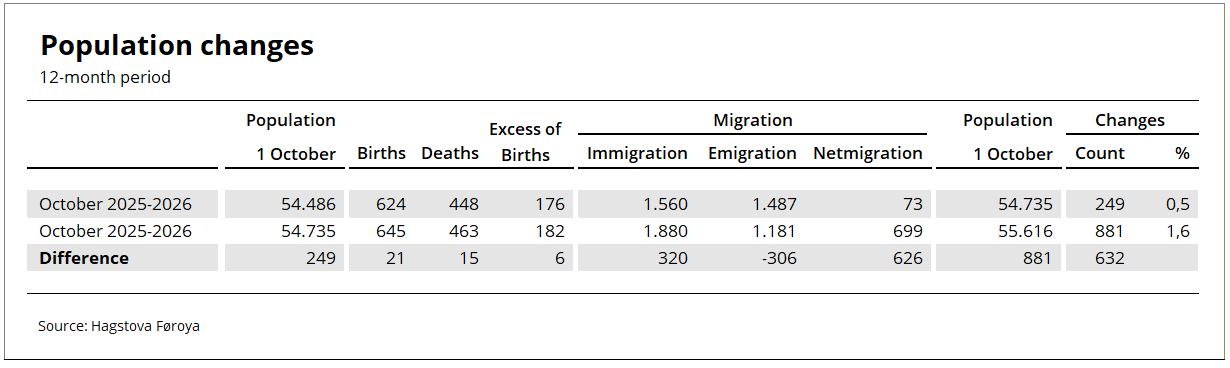
Population growth has picked up again after a few years of relatively slow growth. The population increased by nearly 900 people, or 1.6%, over the past year. The last time population growth was this high was six years ago. Most of the increase was driven by net migration, which was nearly ten times higher than in the preceding twelve-month period.
[px-graph-1]
Net migration drives population growth
Population change is determined by net migration, which is the difference between the number of immigrants and the number of emigrants, and the excess of live births over deaths.
The population growth in the past year was driven by an excess of births of 182 people and a net migration figure of 699 people. While natural increase remained relatively stable, net migration rose sharply, reaching almost ten times the level recorded in the preceding twelve-month period. This increase was driven by both a decline in emigration and a rise in immigration.
See more details in the table below.
More residents without residential ties
Among those who immigrated to the Faroe Islands in recent months, more people were without long-term residency to the Faroe Islands than with long-term residency. The chart below shows an increase in the number of residents without ong-term residency in recent months.
[px-graph-2]
Increasing net migration
The graph below shows the monthly trends for immigration and emigration. Note that trends for the past six months should be interpreted with caution due to incomplete data.
The monthly trends show that immigration is increasing while emigration is declining, resulting in an overall rise in net migration.
[px-graph-3]
Increasing excess of births
The graph below illustrates monthly trends in births and deaths. Note that trends for the past six months should be interpreted with caution due to incomplete data.
The monthly trends show that the number of births is increasing, while the number of deaths remains relatively stable, resulting in a growing natural increase.
[px-graph-4]
Population by municipality
Over the past year, the largest population increases in absolute numbers were recorded in Tórshavn, Runavík and Sjóvar municipalities, followed by Klaksvík, Sunda and Eystur municipalities.
Over the past five years, the largest population increases in absolute numbers were recorded in these same municipalities, with the exception of Sunda, and also in Nes municipality. In relative terms, population growth was highest in Sjóvar municipality, at 19%, followed by Nes municipality at 13%. The population of Runavík municipality grew by 7%, while growth in Tórshavn, Klaksvík and Eysturkommuna was roughly in line with the national average of around 4%.
The largest population declines over the past year were recorded in Tvøroyri and Vágur municipalities. These two municipalities also experienced the largest population declines over the past five years, with decreases of just under 5% in each.
See further details in the table below, which shows the population of each municipality and its constituent villages as of 1 October 2025 and 2026.
[px-graph-5]
Population figures have a one-month lag
The figures have a one-month lag due to delays in registrations, especially regarding address changes, where many registrations are made after the month of address change has ended. To accommodate as many corrections as possible, there is a one-month lag in the data.
About the population figures
The population is defined as all individuals registered in the national register as residents of the Faroe Islands. Population data includes date of birth, gender, place of birth, citizenship, relationship status, and, where applicable, information on immigration and emigration, domestically as well as between the Faroe Islands and other nations.
About the trend
The trend describes the population trend by adjusting for seasonal effects and other error components in the population figure.