GDP and main figures
14. Oct 2022
GDP in current prices up by 8% in 2021

The national accounts provide an overall picture of the national economy, a detailed description of relations between economic sectors and transactions between the Faroes and the rest of the world. The Gross Domestic Product (GDP), a broad measure of overall domestic production, is a key element in the national accounts.
GDP at current prices was just above DKK 22.9 billion in 2021, a year-on-year increase of DKK 1.7 billion (8%). This is a relatively high growth, though slightly lower than in 2016 and 2019.
[px-graph-1]
It should be noted that the figures are expressed in current market prices, i.e. a description of various measurements consisting of year-on-year differences in prices and volumes as opposed to measurements of volume changes. The graph below shows GDP in current prices from 1998 to 2021.
[px-graph-2]
GVA surpasses DKK 20 billion
The table below shows the gross value added (GVA) in current prices across all branches from 2020 to 2021. GVA grew by 8.1% in this period.
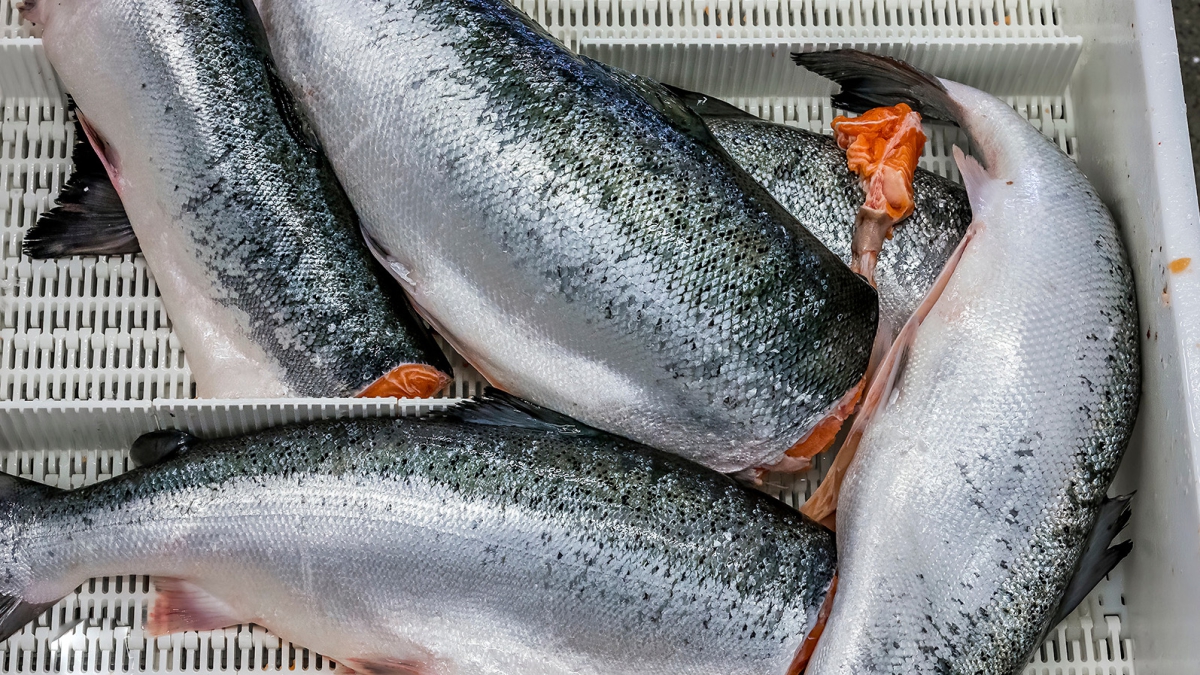
‘Aquaculture’ saw the highest GVA growth, going up by almost DKK 370 million (42%). Aquaculture production reached a record-high in 2021 and salmon prices increased. Aquaculture represents a quarter of the GVA contribution to the overall GVA growth from 2020 to 2021.
[px-graph-3]
Food production, which mainly consists of the manufacture of food from the primary sector to overseas markets, also increased. Here, the GVA increased by almost 12%.
Fish exports increased by about DKK 1.5 billion year-on-year in 2021. This increase has had a positive effect on the ‘transportation and storage’ industry, which saw a GVA increase of almost 10%.
Most branches contributed to the overall GVA growth in 2021, but the GVA growth in the construction branch declined by just over 6% in in 2021. Construction has experienced steady growth in GVA in recent years, but this trend now seems to be reversing.
Most service industries enjoyed GVA growth in 2021 after the downturn caused by the pandemic in 2020.
Domestic consumer spending was relatively high in 2021, with GVA in ‘wholesale, retail trade, hotels and restaurants’ increasing by almost 22%. The number of tourists in the Faroes increased in 2021, but the tourism industry has not yet recovered to 2019 levels.
GVA contribution by branch
The graph below outlines the GVA contribution by main branches from 2019 to 2021. It illustrates the effect that fluctuation in various branches have on the total annual GVA change.
[px-graph-4]
Most service branches did well in 2021. The overall GVA contribution of the service industries was 4.1%, which makes up more than half of the growth in 2021.
Industry, energy and construction have experienced positive GVA contribution every year from 2019 to 2021. In 2021, food production contributed the most to the growth, while the construction industry pulled in the other direction. Public administration has also contributed positively to the overall annual change in GVA. Here, the GVA contribution ranged between 1.1% and 1.3%. The primary sector, traditionally the sector with the greatest fluctuations, had a GVA contribution of 1.9% in 2021.
GDP in current prices affected by inflation
The Consumer Price Index (CPI) increased by 2.7% in 2021, which suggests that the GDP growth in current prices is partly affected by inflation. The CPI is a measure of inflation but not a measure for total economic inflation as it only measures price changes in consumer products and services purchased by households. The CPI thus does not include figures for e.g. investment assets, industrial materials, public expenditures or exports. Nevertheless, the CPI is a decent indicator of whether economic inflation is rising or falling.
Tjóðarroknskapurin við smærri rættingum
Í samband við útgávu av tjóðarroknskapinum frá mars í ár var gjørd ein størri endurskoðan av tjóðarroknskapinum fyri øll árini frá 1998 til 2020. Til hesa útgávuna eru smærri rættingar gjørdar umframt. Ávirkanin av hesum rættingum er ymisk frá einum ári til annað, men yvirskipaða myndin er tætt við óbroytt. Í 2019 og 2020 hækkar bruttotjóðarúrtøkan í ársins prísum við ávikavist 46 og 52 milliónum krónum, soleiðis at árliga prosentbroytingin í 2020, sum í mars var -2,8 prosent, nú er -2,7 prosent.