Consumer price index
20. Dec 2024
Annual inflation at 0.8%

The Consumer Price Index (CPI) measures inflation as experienced by Faroese households in their daily living expenses. The latest CPI figures are from November 2024.
[px-graph-8]
The current consumer price growth is the slowest we have seen since November 2020.
[px-graph-1]
Varying price trends
Of the 12 main categories in the CPI, ‘Food and non-alcoholic drinks’ makes up the largest portion of the average Faroese household spending. This category is also the key contributor to the price growth in this quarterly CPI report.
Other goods and services contributed to lower overall price growth. Prices in ‘Housing’, for example, fell 2.7% year-on-year, and ‘Clothing and footwear’ prices fell 2.1%. ‘Health’ and ‘Transport’ also saw slight year-on-year price decreases.
[px-graph-2]
Grocery prices still rising
Grocery prices continue to climb, rising 4% since November 2023.
[px-graph-3]
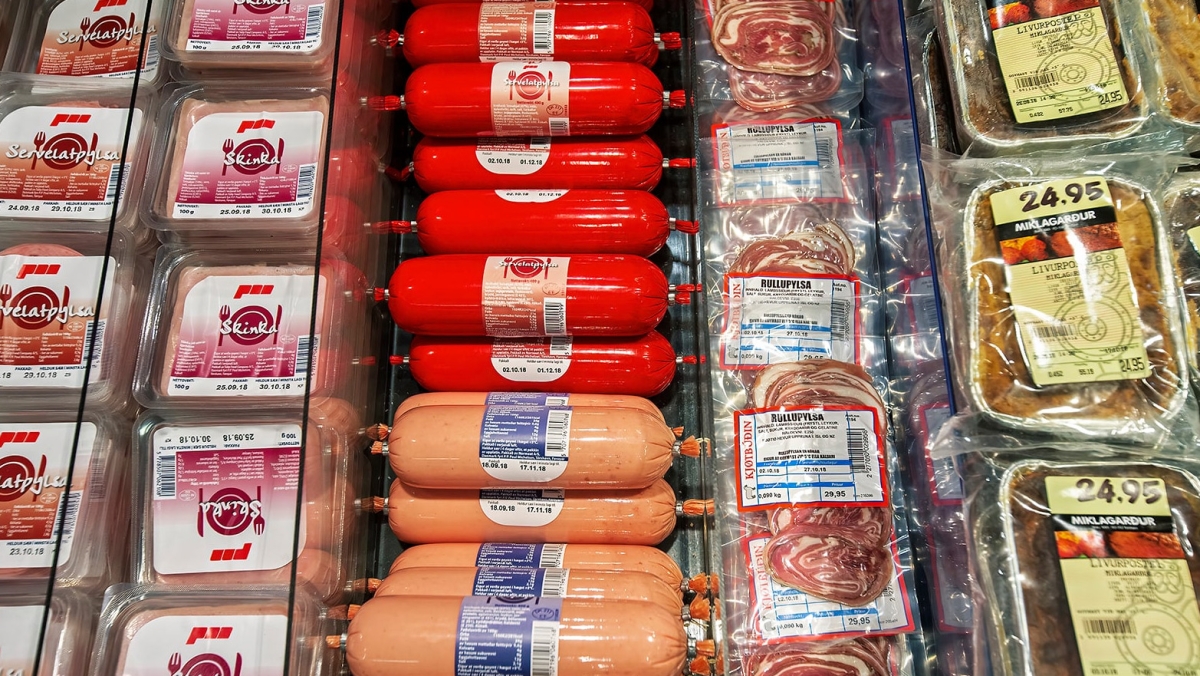
Within the ‘food and non-alcoholic drinks’ category, meat prices have risen the most, up 7.3% year-on-year, with lamb prices seeing the most significant increase. Vegetable prices increased by 5.3%, while the price of milk, cheese and eggs rose 3.7%.
[px-graph-4]
Sweet foods and beverages have also become more expensive in the past year, rising by more than 5%.
Lower housing expenses
Housing costs for Faroese households saw an average increase of 2.7% in the past year.
[px-graph-7]
The average price of oil used for household heating fell 7.5% year-on-year, contributing to lower overall price growth. Interest expenses now contribute less to the inflation rate compared to the CPI reports in the past 18 months.
[px-graph-9]
Electricity and district heating prices are up due to a price hike in January 2024.
Electricity prices are seeing significant fluctuations in the countries around us. Here, the Faroese price trend differs from that in other countries, which is also one of the reasons why the Faroese price growth is not necessarily at the same level as in other countries. Over the past four years, electricity prices in Denmark have risen 41%, compared to 17% in the Faroes.
[px-graph-9]
Liquid fuels for household heating and transportation fuel constitute a significant portion of average household expenses in the Faroes, thereby exerting a notable influence on the inflation rate. The price of fuel for transport fell by almost 10% year-on-year.
Slower price growth than in neighbouring countries
The annual Faroese inflation sits below the EU average of 2.2%. Denmark and Sweden had an annual inflation rate of 1.6%, Finland had a rate of 1.7% and Norway had 2.4%, while Iceland had the highest inflation of the Nordics at 4.8%.
[px-graph-6]
Note that the EU inflation rate is based on the HICP index (the Harmonised Indices of Consumer Prices), which means that rental costs are not included.
Stutt um brúkaraprístalið og prísvøkstur
Prísvøkstur ella inflatión er eitt mát fyri, hvussu nógv brúkaraprístalið er hækkað. Brúkaraprístalið mátar prísgongdina á vørum og tænastum, sum eru partur av nýtsluni hjá húsarhaldunum í Føroyum. Tað merkir, hvussu nógv húsarhaldini skulu rinda fyri tær vørur og tænastur, sum tey keypa. Um árligi prísvøksturin er fimm prosent, so skal ein rinda 105,- krónur fyri at keypa somu vørur og tænastur, sum ein kundi keypa fyri 100,- krónur árið frammanundan.
Tá prísvøksturin er stórur, verður peningurin í roynd og veru minni verdur, tí tú fært færri vørur og tænastur fyri somu upphædd. Tað merkir, at keypiorkan hjá húsarhaldunum minkar, um inntøkan ikki veksur eins nógv.
Prísirnir á vørum broytast ymiskt yvir tíð, og vektargrundarlagið er avgerandi fyri, hvussu stóra ávirkan prísbroytingarnar í teimum ymsu vørubólkunum hava á brúkaraprístalið.
Hagstovan ger mánaðarliga uppgerð av brúkaraprístalinum fýra ferðir árliga – í februar, mai, august og november. Uppgerðin verður gjørd eftir altjóða leisti, sum ger tað møguligt at bera saman prísbroytingar við uppgerðir av prísbroytingum hjá øðrum londum, ið framleiða brúkaraprístalið eftir sama altjóða leisti.
Tað finnast eisini onnur vísitøl fyri prísgongd, m.a. fyri vørur og tænastur framleiddar til annað enn endaliga húsarhaldsnýtslu og tann sonevndi BTÚ-deflatorurin, ið er mát fyri samlaðu prísgongdina á øllum vørum og tænastum framleiddar í einum búskapi. Brúkaraprístalið er sostatt eitt av fleiri mátum fyri inflatión í einum búskapi.