
Employees
12. May 2020
Big drop in employee numbers in April

The trend shows a decrease in the number of employees after six years with a steady increase. There are now 1,250 fewer employees than in April 2019.
[px-graph-1]
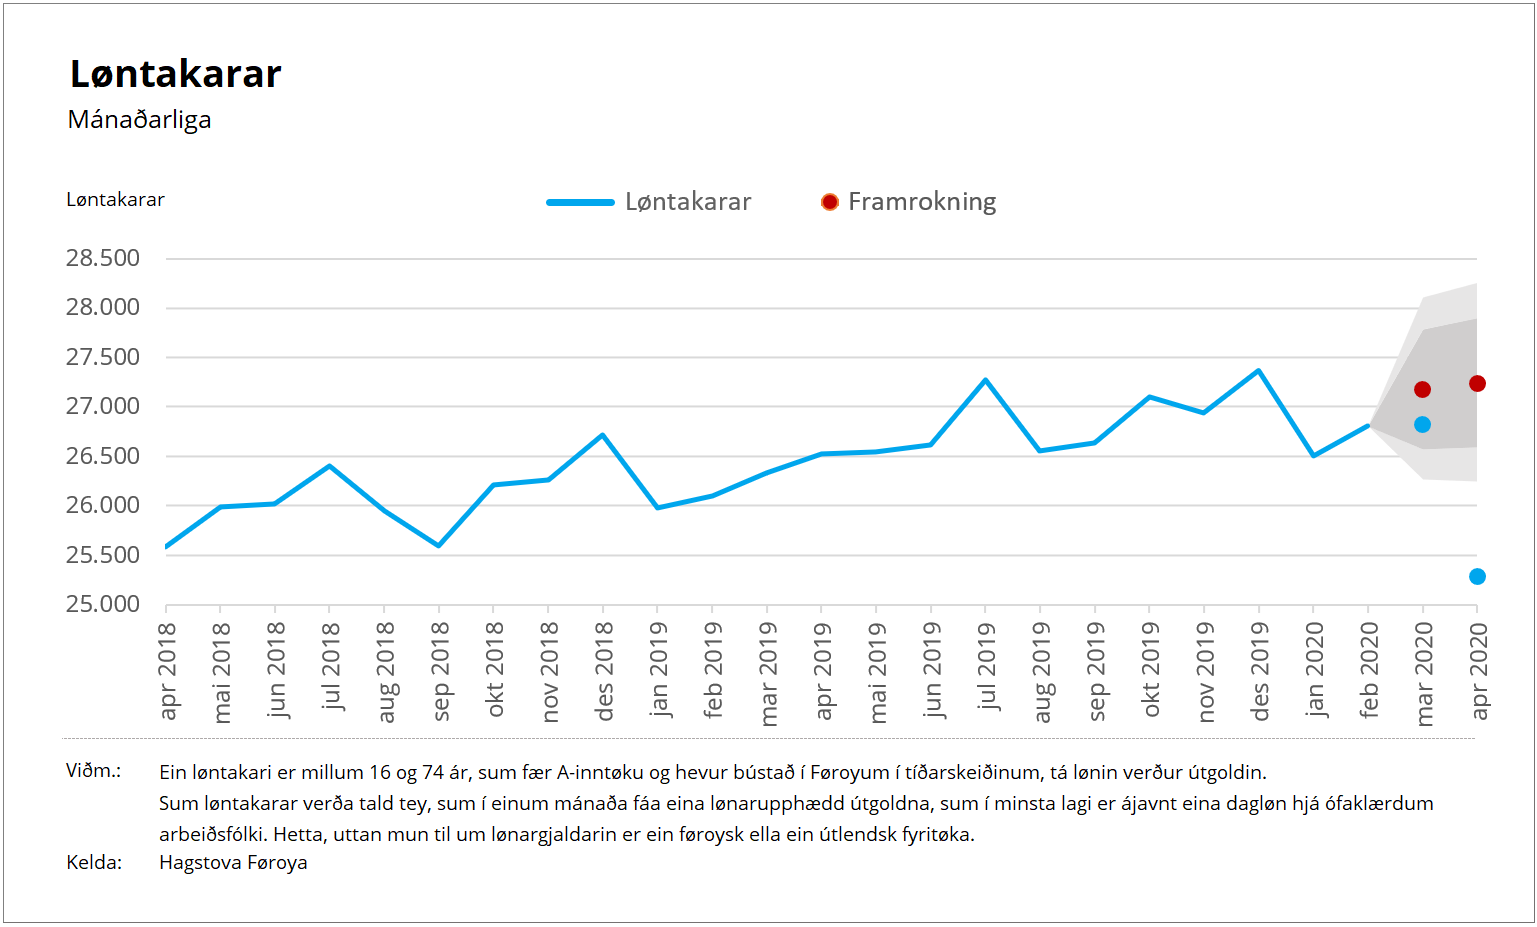
Before and after COVID-19
The graph below shows a projection of how March and April would turn out assuming the employee trend remained unchanged. The blue dots show the real figures from March and April this year, while the red dots show the projected estimate (the point estimate) for these two months. The difference between the blue and red dots thus give an indication of how COVID-19 has affected the employee numbers. The grey field shows the degree of uncertainty (80% and 95%).
The projection shows about 27,250 employees in April. The real figure was about 25,300 – a difference of 1,950 employees (7%) compared with the projected estimate.
Decline for both genders
In April, there were approximately 13,150 male and 12,100 female employees. This is a decrease of 550 men and 700 women compared with April 2019.
[px-graph-2]
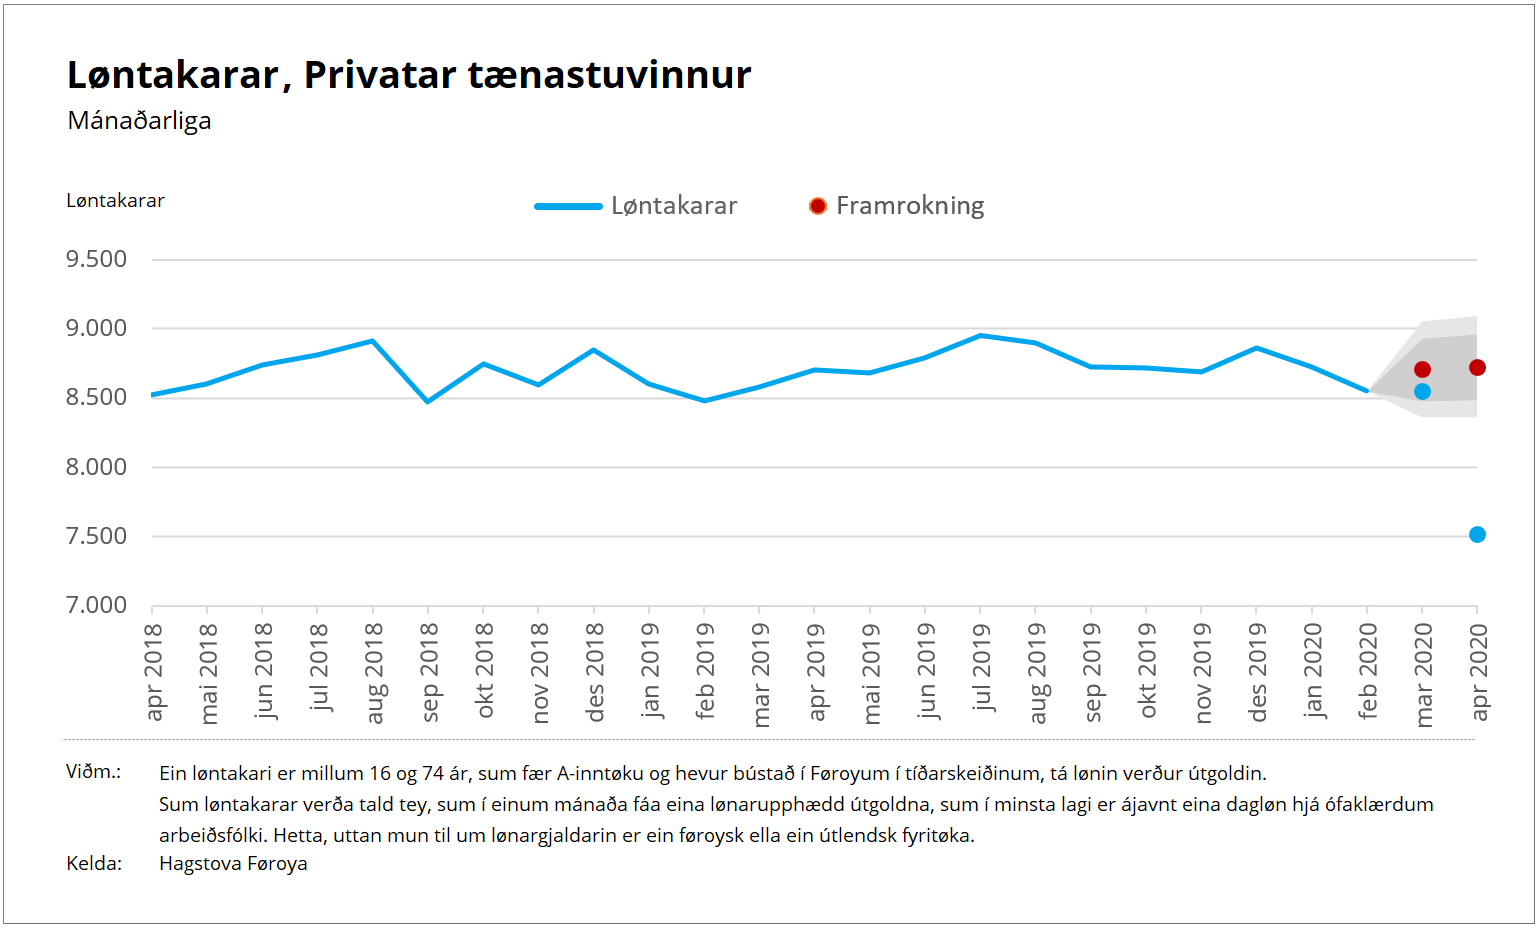
Private service sector saw the biggest drop
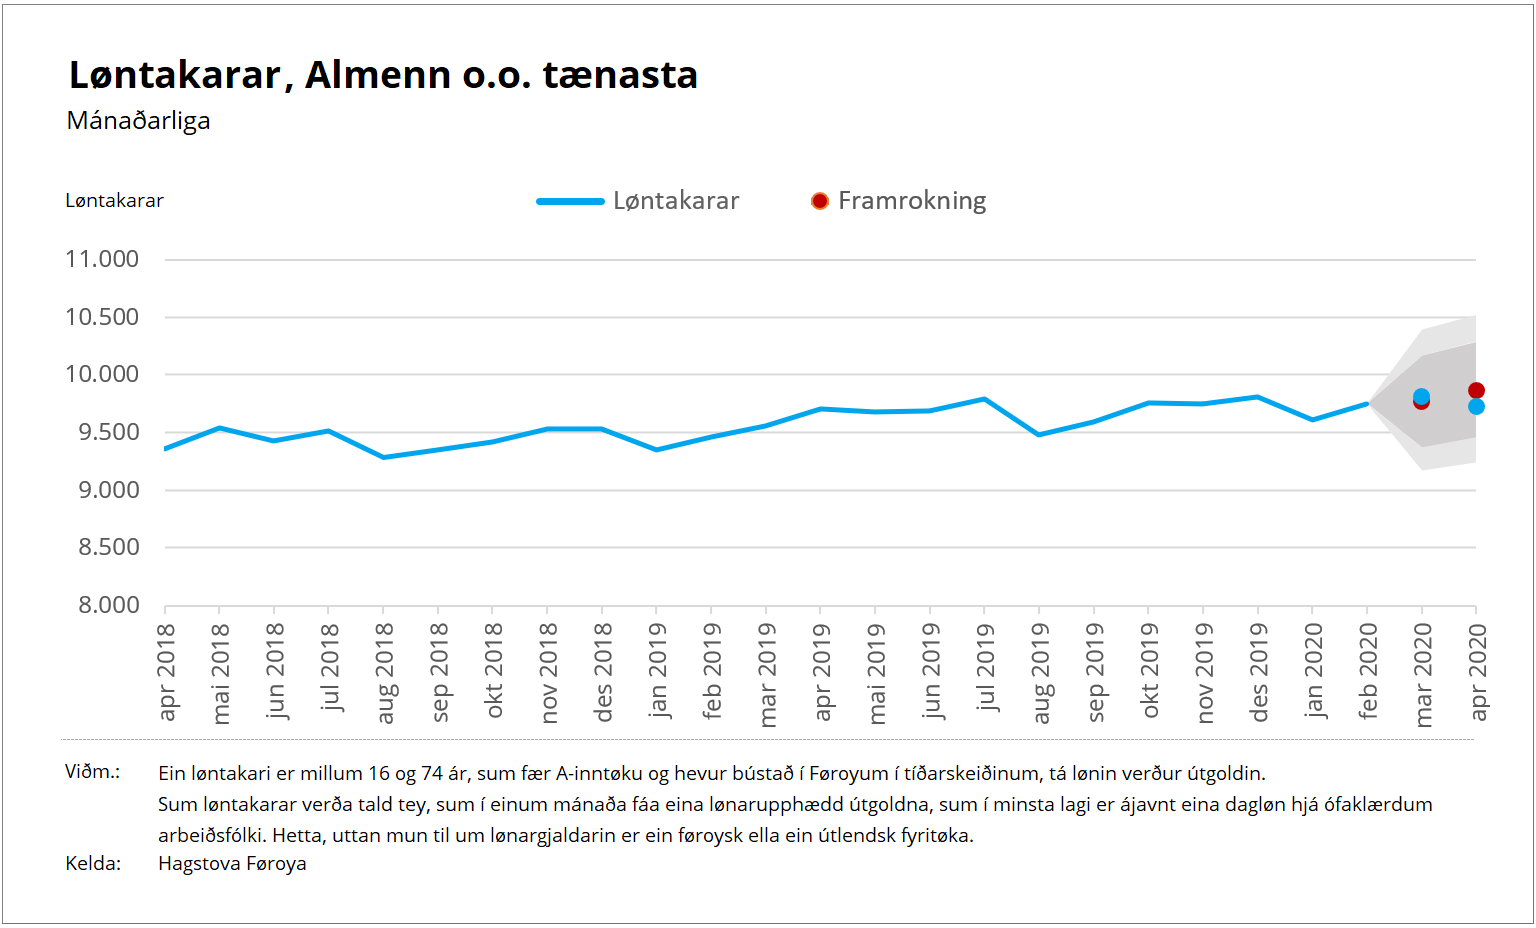
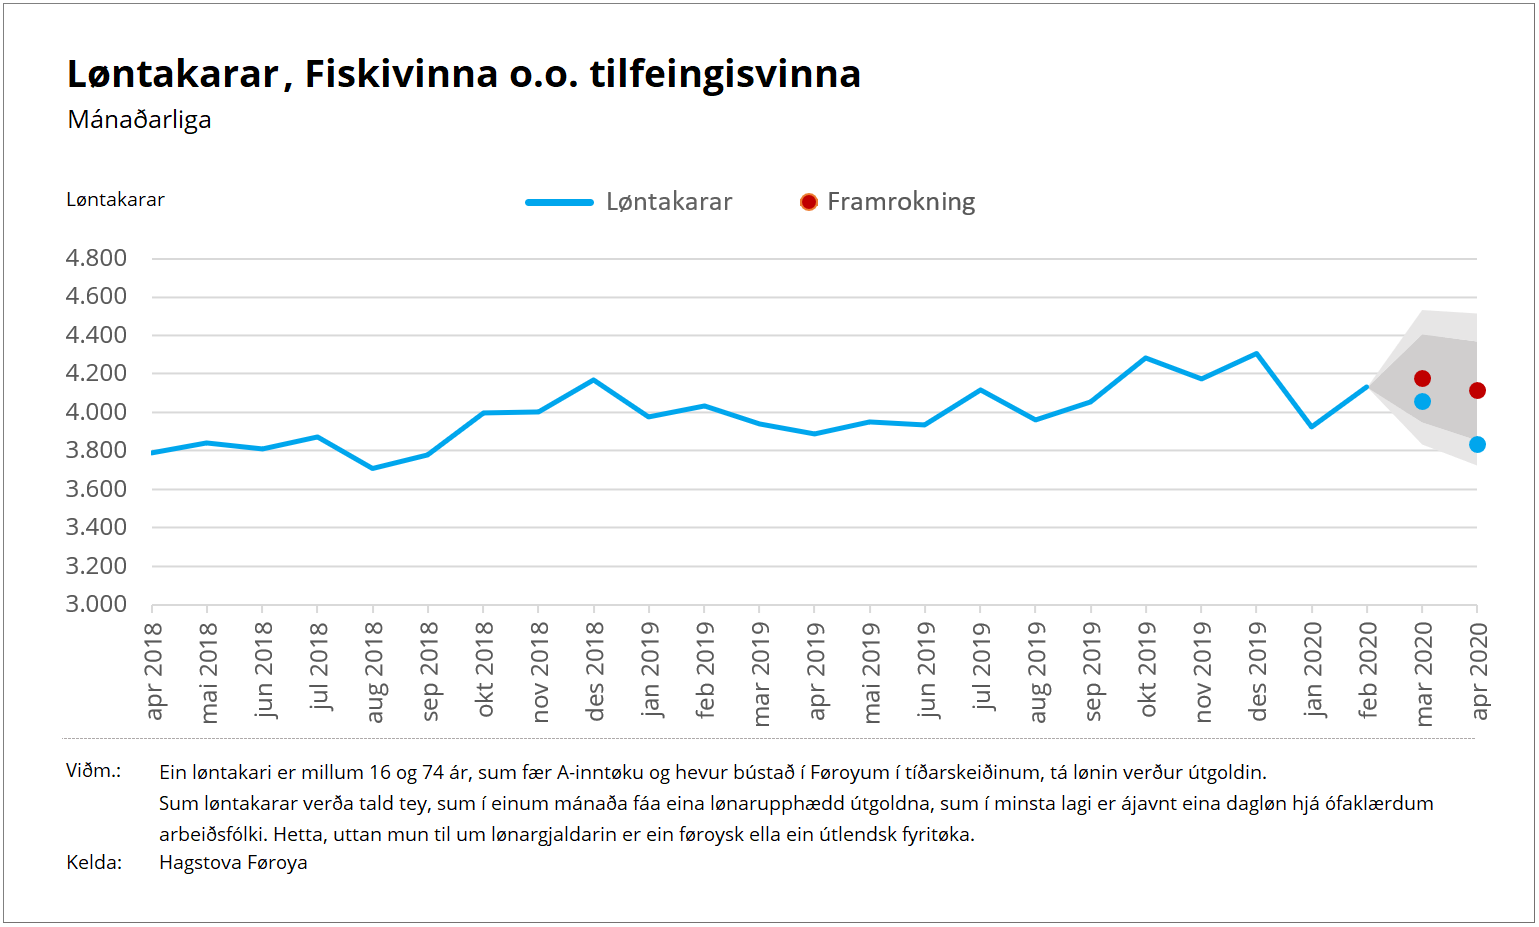
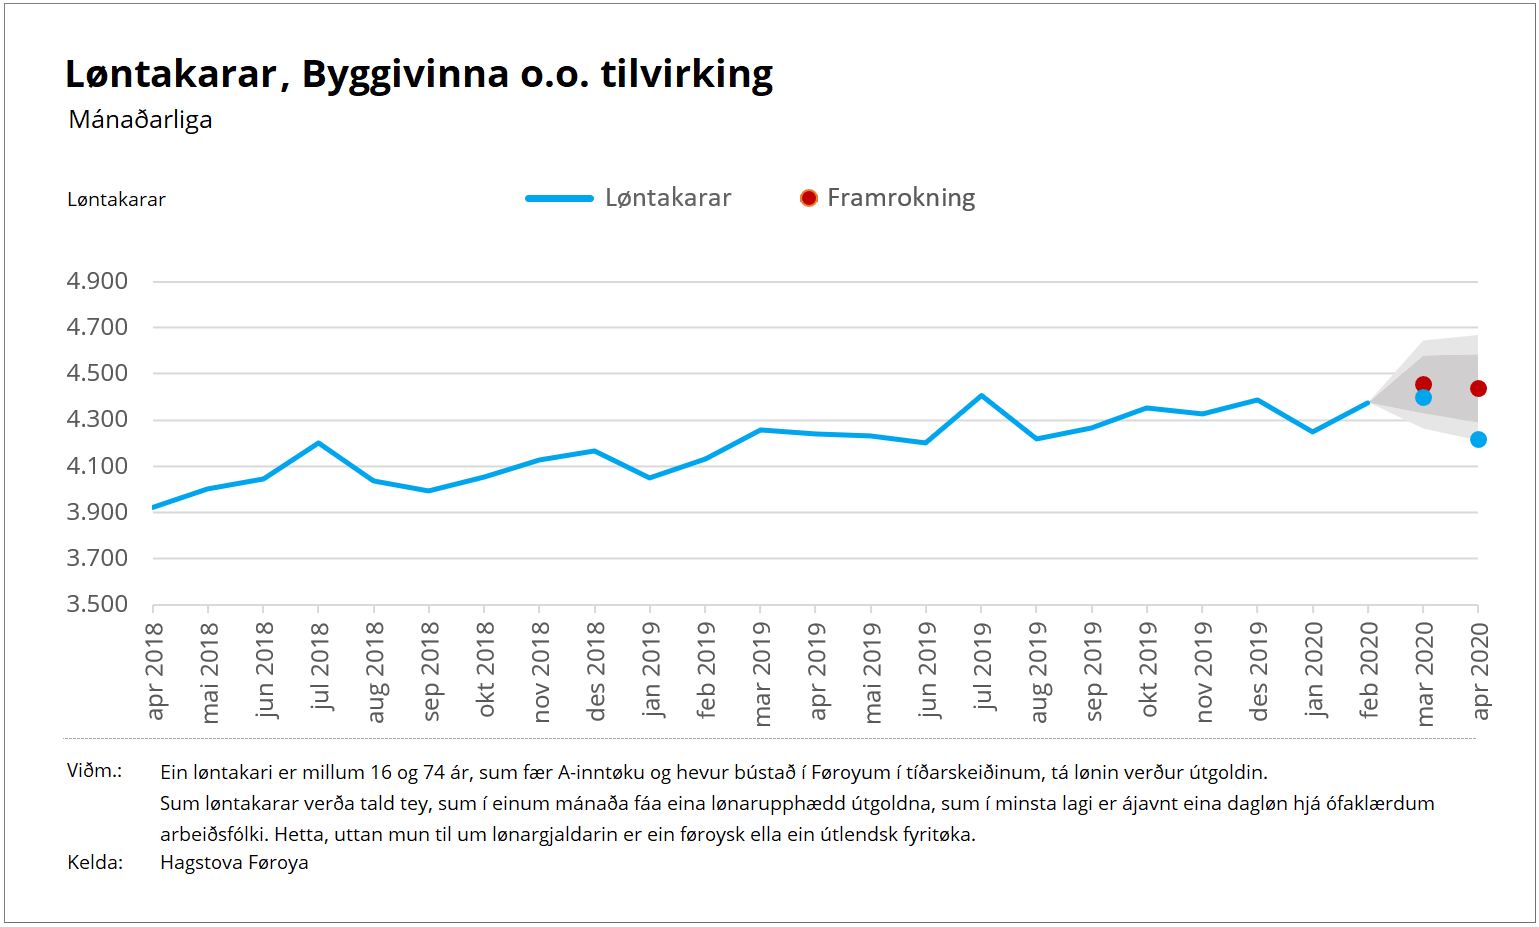
The four graphs below show the employee figures in the four main industrial sectors: ‘the public service sector’, ‘the private service sector’, ‘fishing and other natural resources’ and ‘construction and other manufacturing’ over the past two years.
The blue line shows the general employee numbers, the blue dots show the employee numbers in March and April 2020, and the red dots show the projected estimate assuming the employee trend remained unchanged. The grey field shows the degree of uncertainty (80% and 95%).
A comparison between the real and the projected figures for March and April shows that the private service sector represents the biggest drop in employee numbers..
The private service sector had some 7,500 employees in April. The projected estimate was 8,700 – a difference of 1,200 employees (14%).
Figures for the other three main industrial sectors are generally in line with the projected estimate.
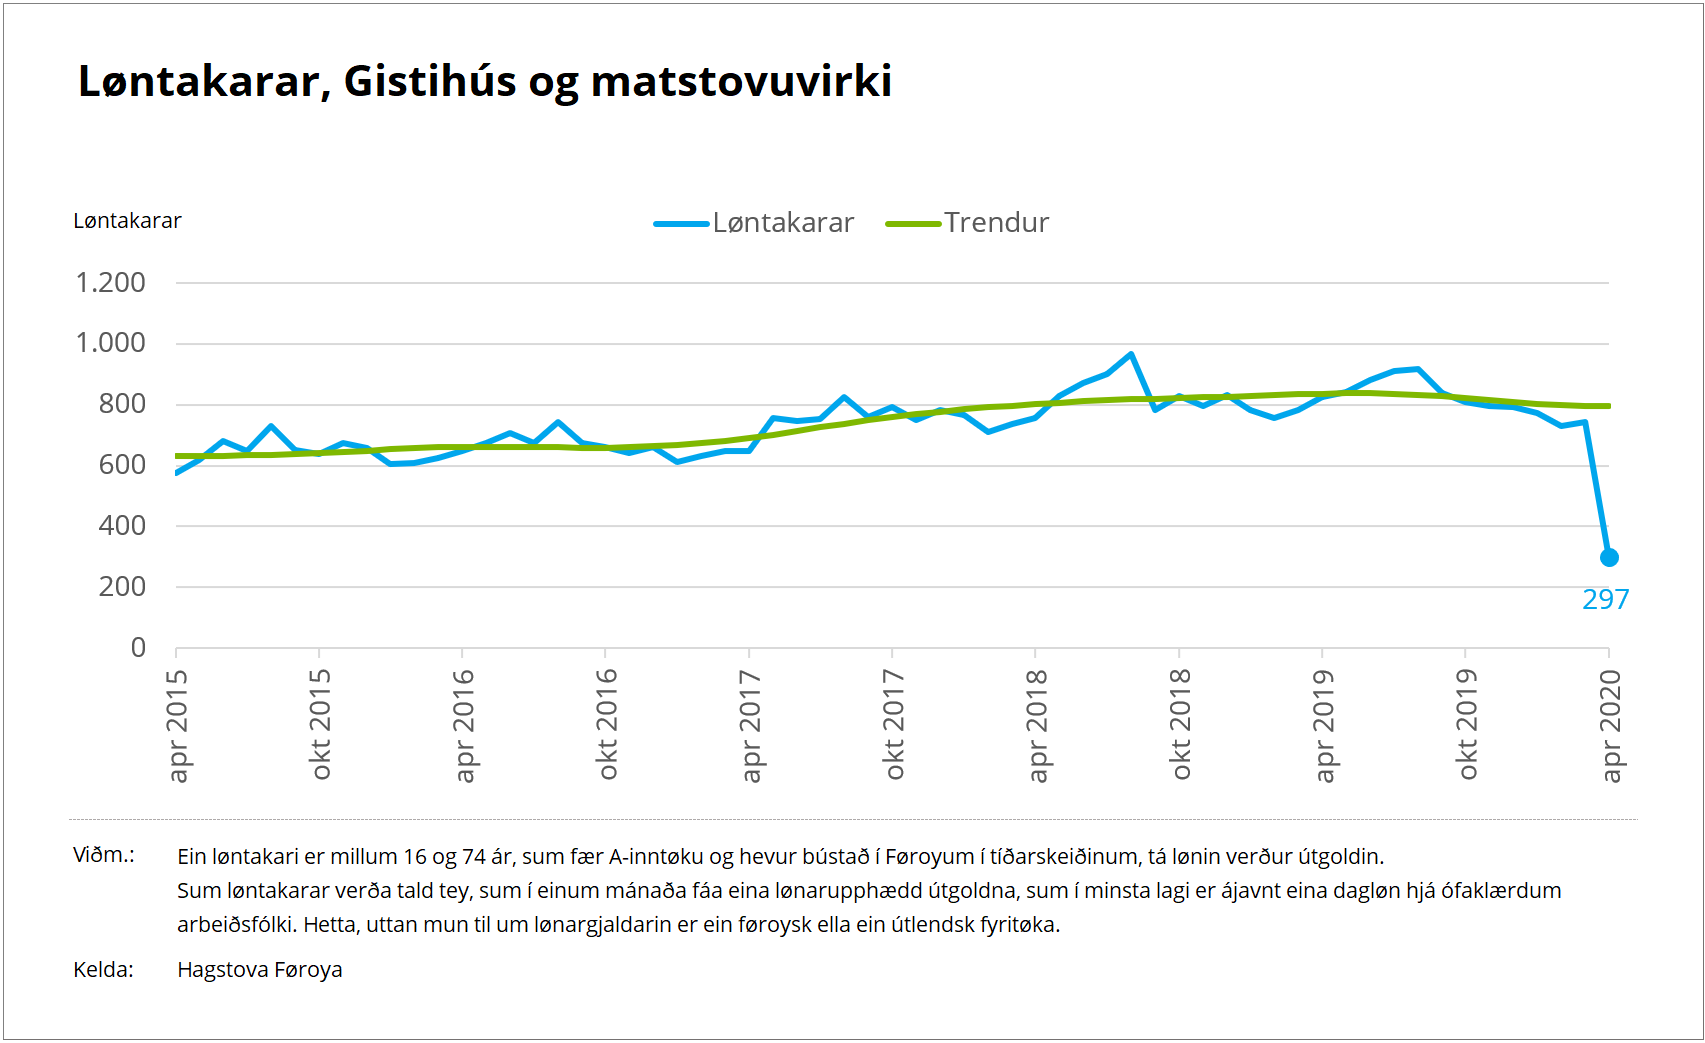
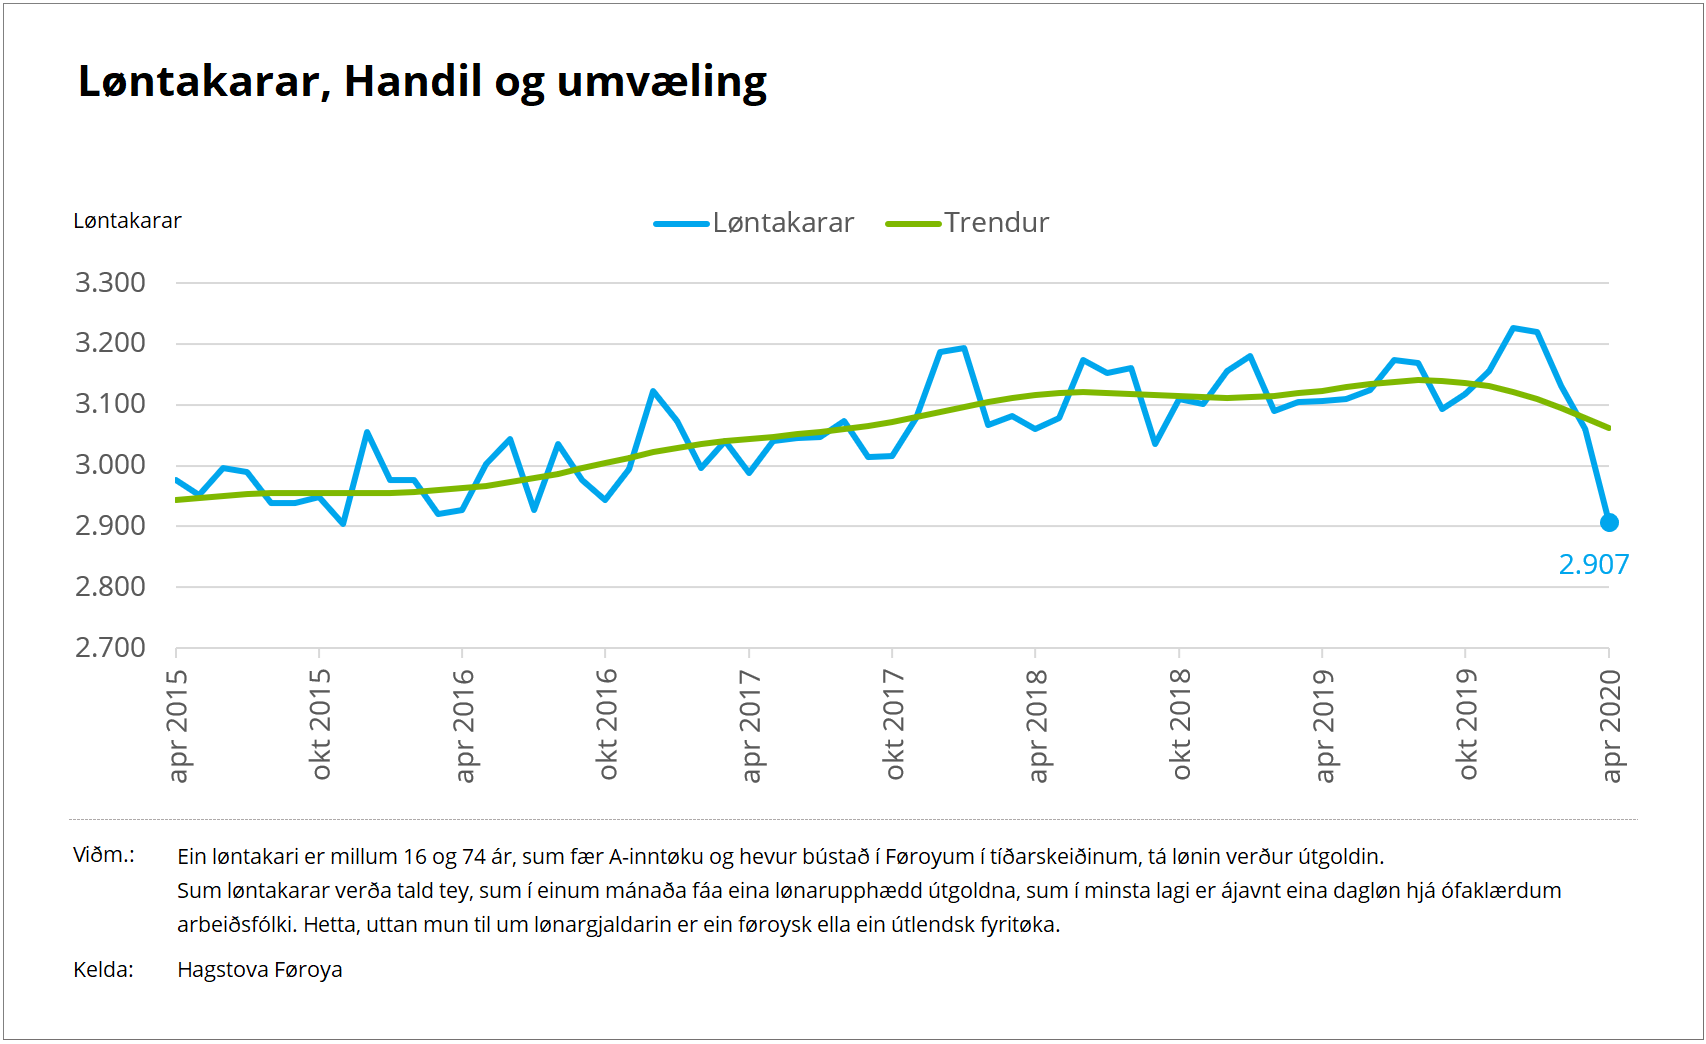
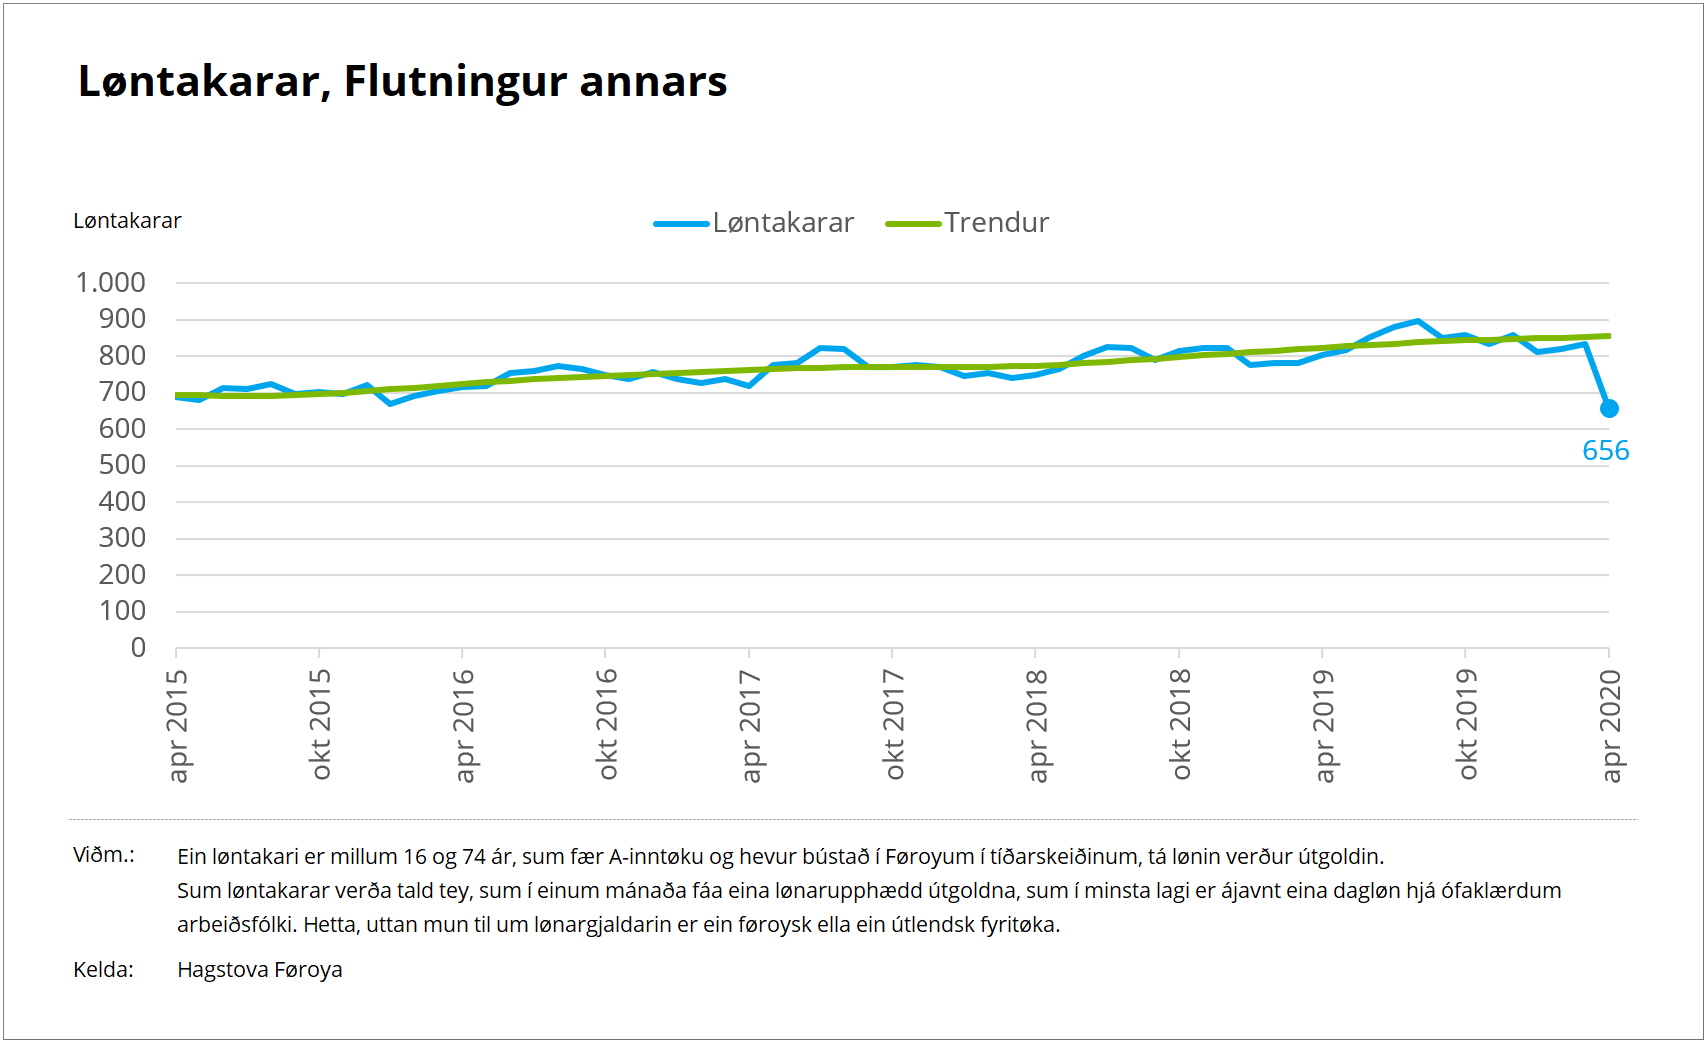
Private service sector subdivided into branches
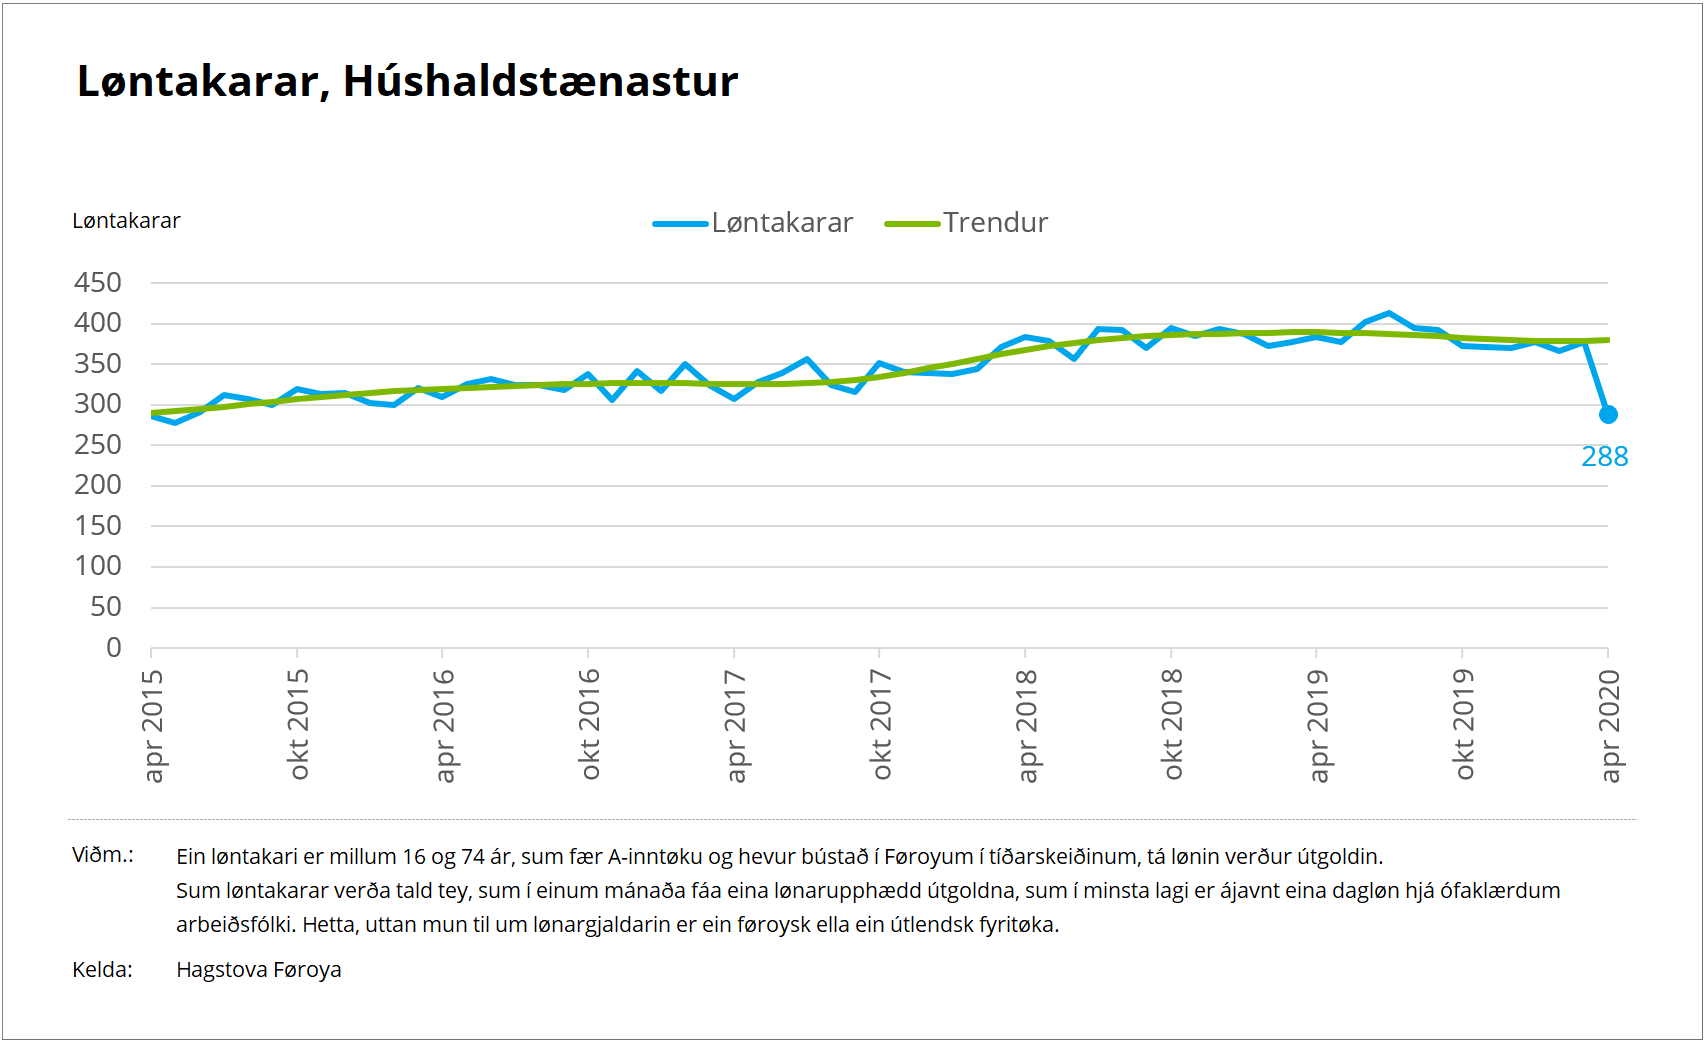
The private service sector branches with the biggest drop in employee numbers are ‘hotels and restaurants’ (where employee numbers are cut in half), ‘trade and repair’, ‘other transport’ and ‘household services’.
Detailed employee analyses grouped into age, citizenship, gender and industrial sectors can be found in the statbank here.
About employees
An employee is anyone aged between 16 and 74 who earns a wage that is subject to tax at source (PAYE) and resides in the Faroe Islands at the time of wage payment. A person is regarded as an employee if he or she receives a wage payment which is no lower than a day wage for an unskilled worker, regardless of whether the wage is paid by a Faroese or an overseas company.
About the trend
The trend describes the employee trend by adjusting for seasonal effects and error components in the figures.
About the main industrial sectors
Grouped under the ‘fishery and other natural resources’ sector are the following branches: agriculture, fishing, aquaculture, extraction of raw materials, fish processing and activities not elsewhere indicated.
The ‘construction and other manufacturing’ sector includes: shipyards/machine shops, other manufacturing, construction and energy.
The ‘private services’ sector includes: trade and repair, hotels and restaurants, sea transport, other transport, communications, finance and insurance, business services. household services and organisations, culture, etc.
‘Governmental and other services’ includes: public administration and services (central administration, municipalities, education, health and social work), government institutions and the Ministries of Education and Health.