
Population
11. Aug 2025
Population above 55,000 on 1 July — up 0.7% year-on-year

The population count on 1 July reveals that the Faroese population has now, for the first time, exceeded 55,000. At the start of the population growth in 2013, the population was at about 48,000. It has thus increased by some 7,000 people (14.6%) since then.
The last 1,000-person milestone was reached three years ago. The total population figure surpassed 50,000 for the first time in 2017. This was followed by an approximate annual population increase of 1,000 people – 51,000 in 2018 and 52,000 in 2019. The figure reached 53,000 in 2021, followed by 54,000 in 2022. And now, three years later, the population has surpassed 55,000.
[px-graph-1]
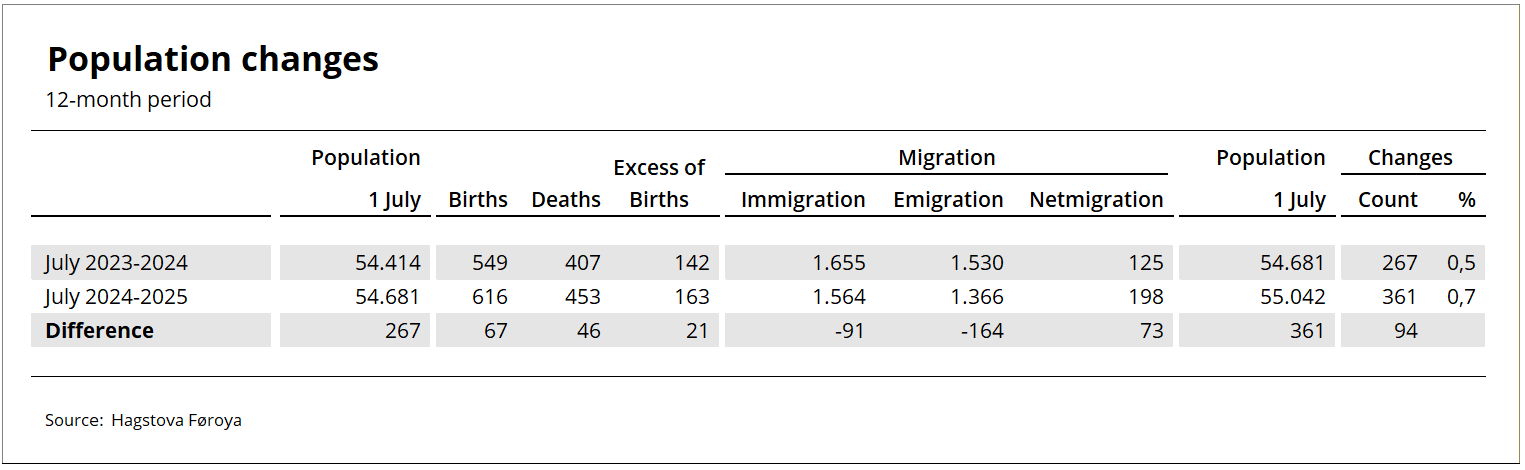
Excess of births and net migration rising
The population trend is determined by net migration, i.e. the difference between the number of immigrants and the number of emigrants, and the excess of live births over deaths.
The population growth in the past year was driven by an excess of births of 163 people and a net migration figure of 198 people. This corresponds to an excess of births figure of 3.0 births per 1,000 people and a net migration figure of 3.6 people per 1,000 people.
The excess of births was higher than in the previous 12-month period because although there were more deaths, there were even more live births.
Net migration fell slightly compared to the previous year as the decrease in immigration outpaced the decrease in emigration. The previous year saw an excess of births of 2.6 per 1,000 people and a net migration of 2.3 per 1,000 people.
See more figures in the table below.
Less migration
The graph below shows the monthly trends for immigration and emigration. Note that trends for the past six months should be interpreted with caution due to incomplete data.
The monthly migration trend indicates that the declining trend in emigration is continuing, while the immigration trend is steadier.
[px-graph-2]
Birth rate rising
The graph below illustrates monthly trends in births and deaths. Note that trends for the past six months should be interpreted with caution due to incomplete data.
The graph indicates that the trend in birth rates is rising, while the death rate trend is steadier.
[px-graph-3]
Population by municipality
The table below shows the population across the 29 municipalities, with details for each town and village on 1 July 2024 and 1 July 2025.
The municipality with the highest population growth was Tórshavn, which contains more than 40% of the total Faroese population.
The second-highest population growth was registered in Sjóvar municipality, followed by Nes, Skálavík and and Rúnavík.
Tvøroyri and Vágs municipality experienced the biggest population decline.
[px-graph-4]
Population figures have a one-month lag
The figures have a one-month lag due to delays in registrations, especially regarding address changes, where many registrations are made after the month of address change has ended. To accommodate as many corrections as possible, there is a one-month lag in the data.
About the population figures
The population is defined as all individuals registered in the national register as residents of the Faroe Islands. Population data includes date of birth, gender, place of birth, citizenship, relationship status, and, where applicable, information on immigration and emigration, domestically as well as between the Faroe Islands and other nations.
About the trend
The trend describes the population trend by adjusting for seasonal effects and other error components in the population figure.