
Population
10. Mar 2020
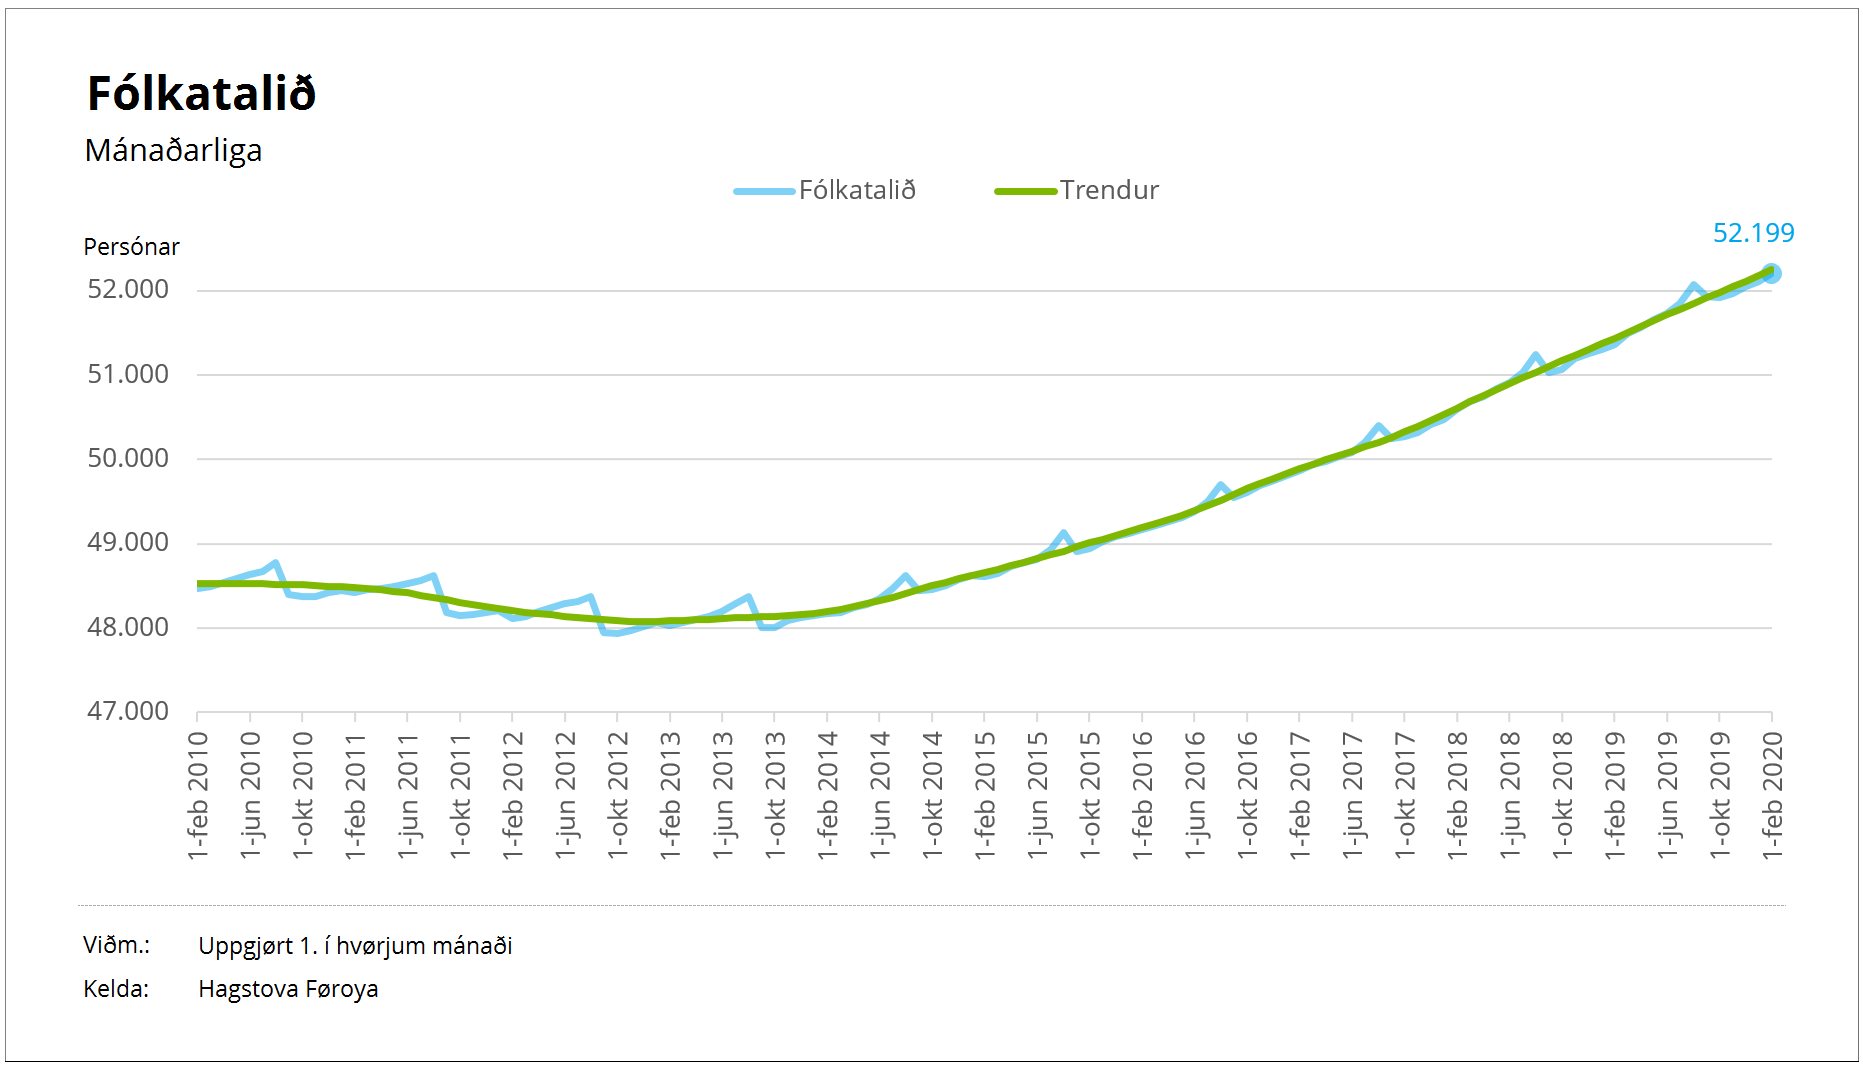
Steady population rise continues
Trend shows continued population growth
Since the population started to rise again in late 2013/early 2014 when the population was around 48,300, the figure has been on a steady rise, with approx. 70 new citizens being added to the total every month.
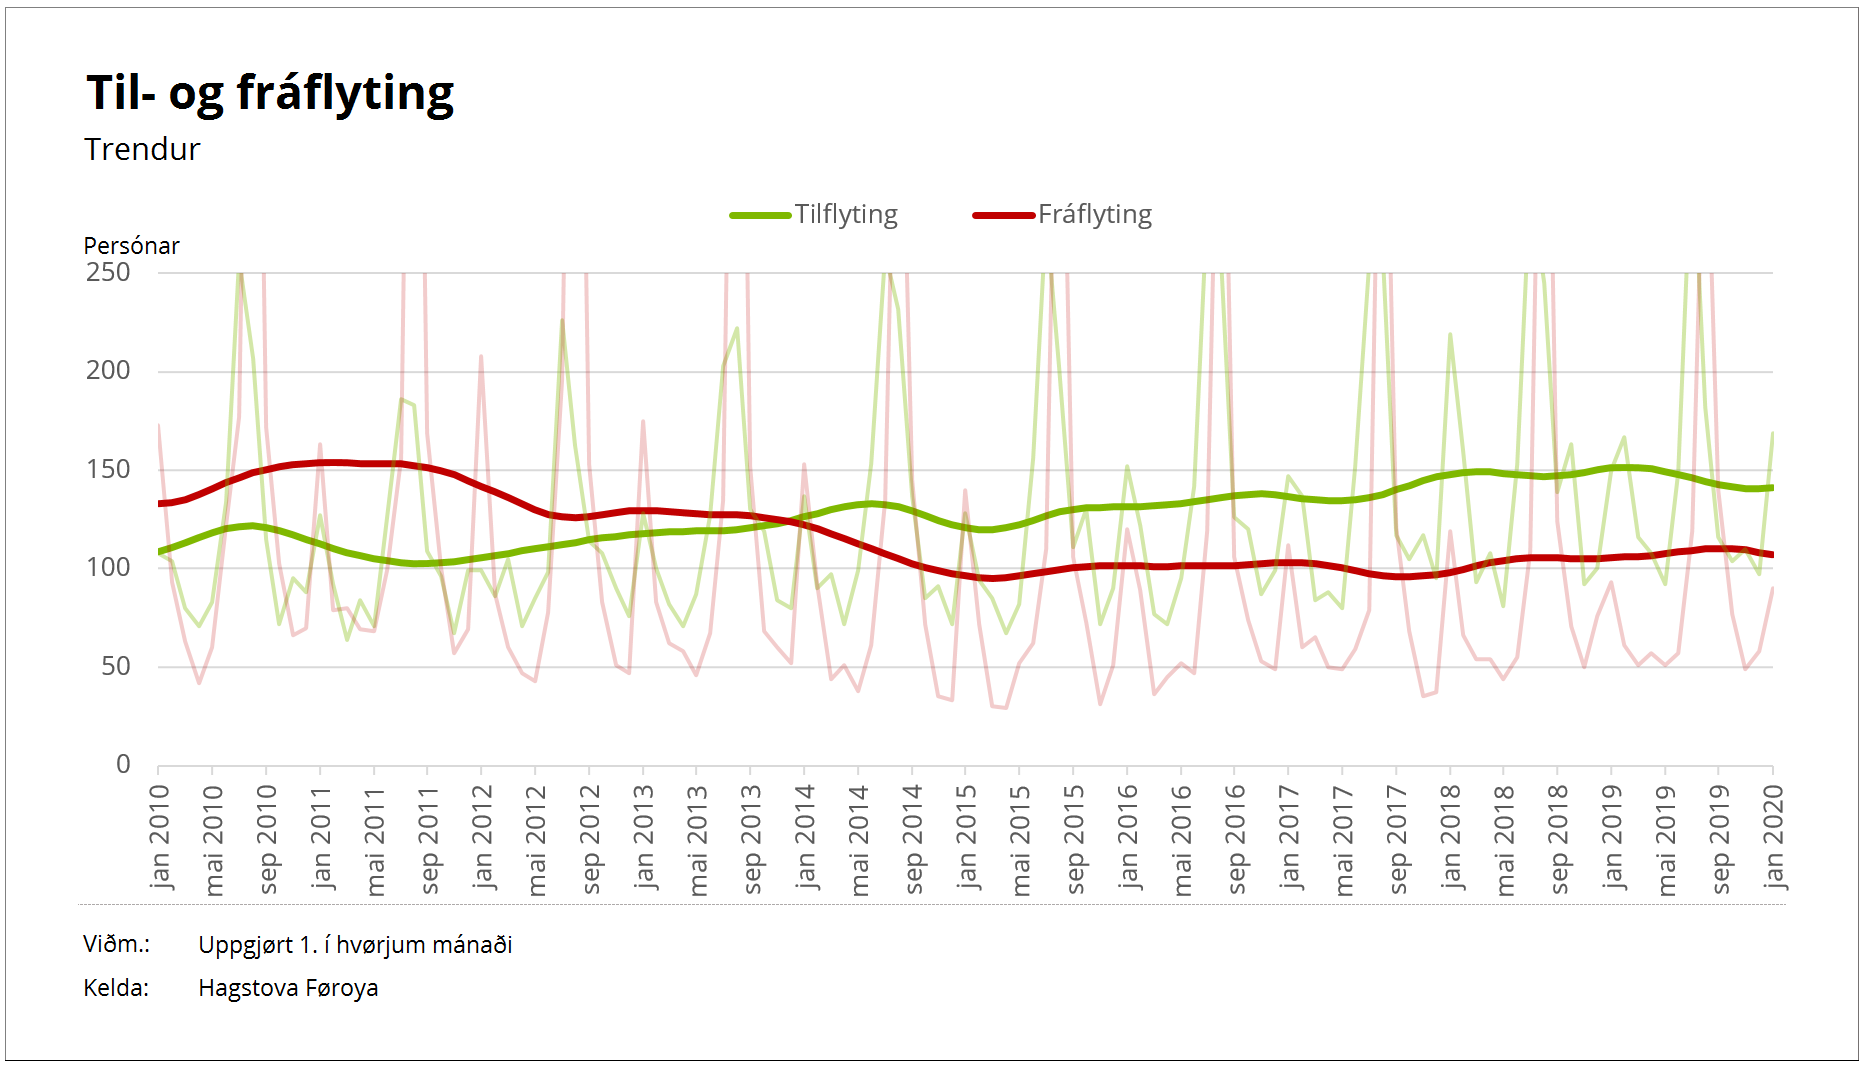
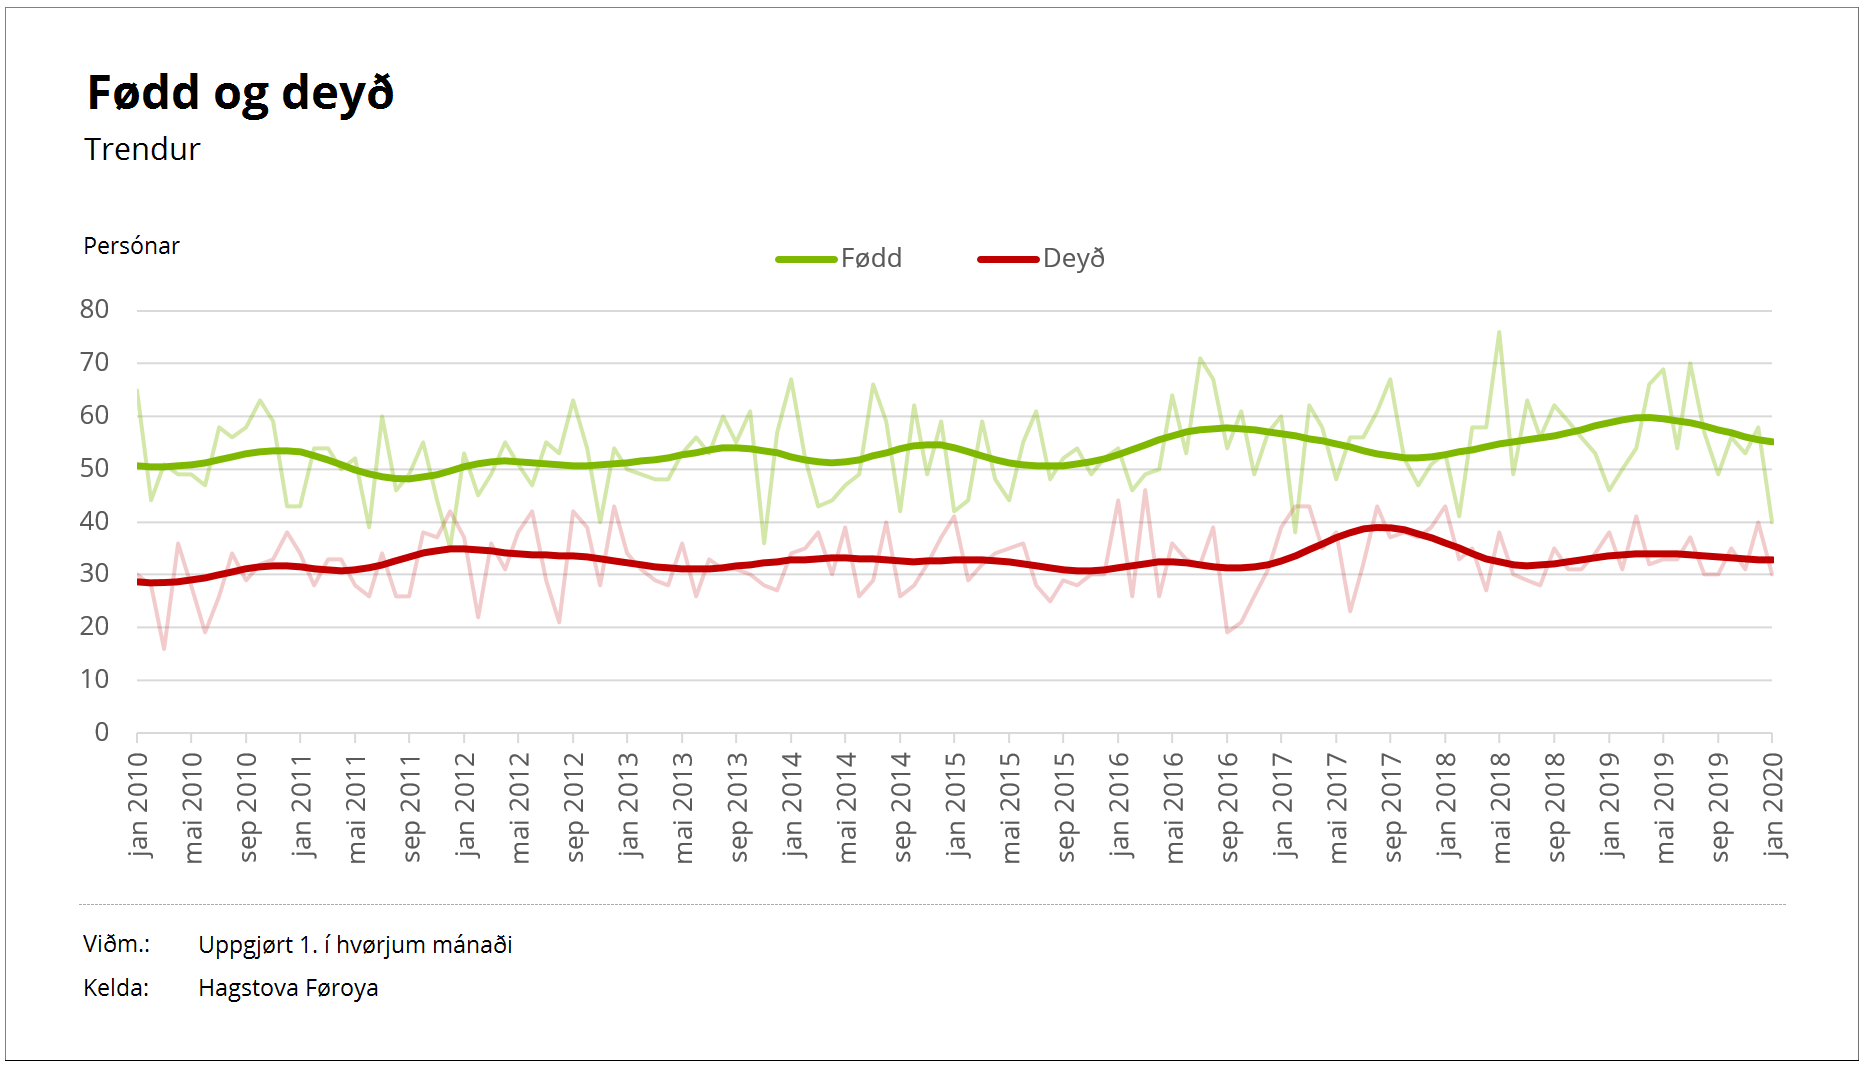
The graph below shows continued population growth. New migration patterns, with decreasing emigration and increasing immigration, are a key reason for this growth. The excess of births over deaths has also increased in recent years.
Net migration adds about 45 people per month
The four variables affecting the growth of the population are immigration, emigration and the number of births and deaths.
The trend in the graph shows a drop in emigration in the second half of 2011, but since 2015 the figure has remained steady at 95-100 people per month. Immigration has seen a steady rise since 2011, from just over 100 to 145 people per month.
Net migration – the difference between immigration and emigration – now adds over 45 people to the monthly population figure.
The solid green line shows the trend for immigration and the solid red line shows the trend for emigration. Registered monthly figures are represented by semi-transparent lines.
Excess of births adds 20-25 people per month
for the past many years. But this number has exceeded 55 in the past two years, which adds up to 670-680 births per year.
The number of deaths has remained steady for many years, at 30-35 per month.
The excess of births adds about 25 people to the population per month.
Births are represented in the green line and deaths in the red line.
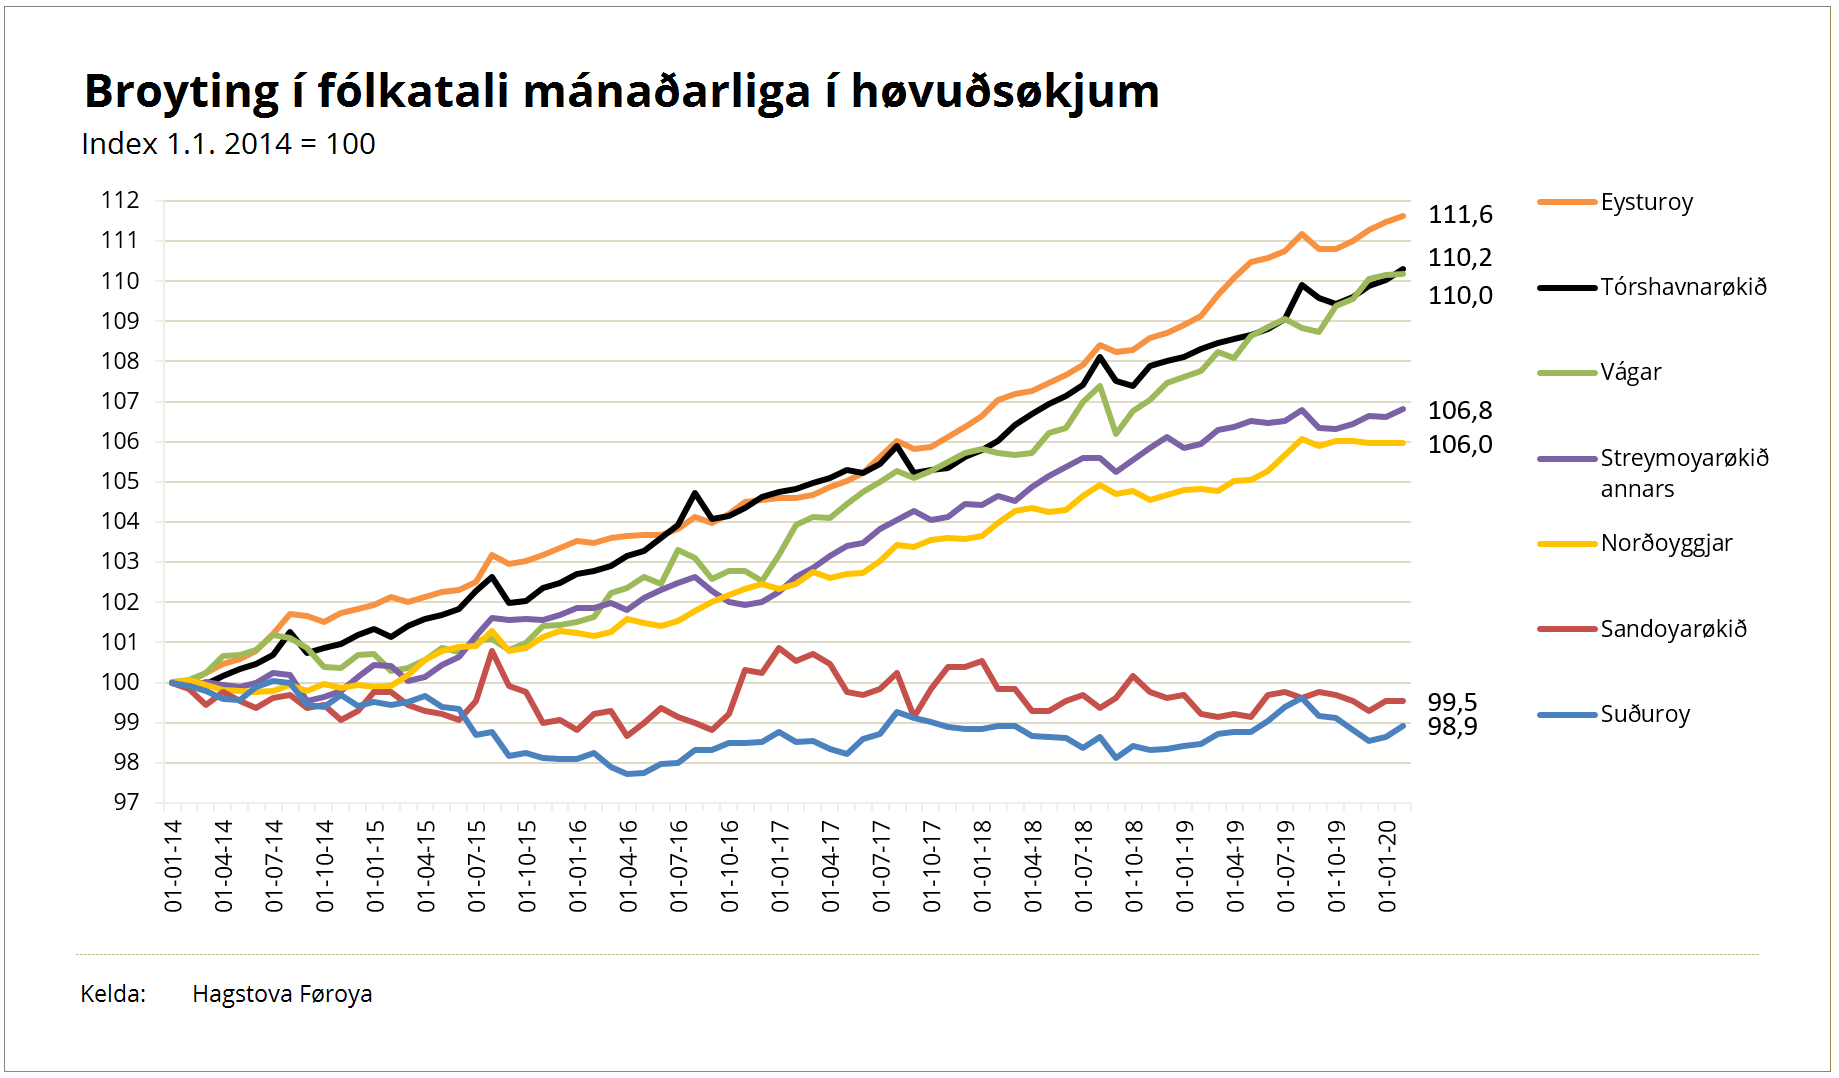
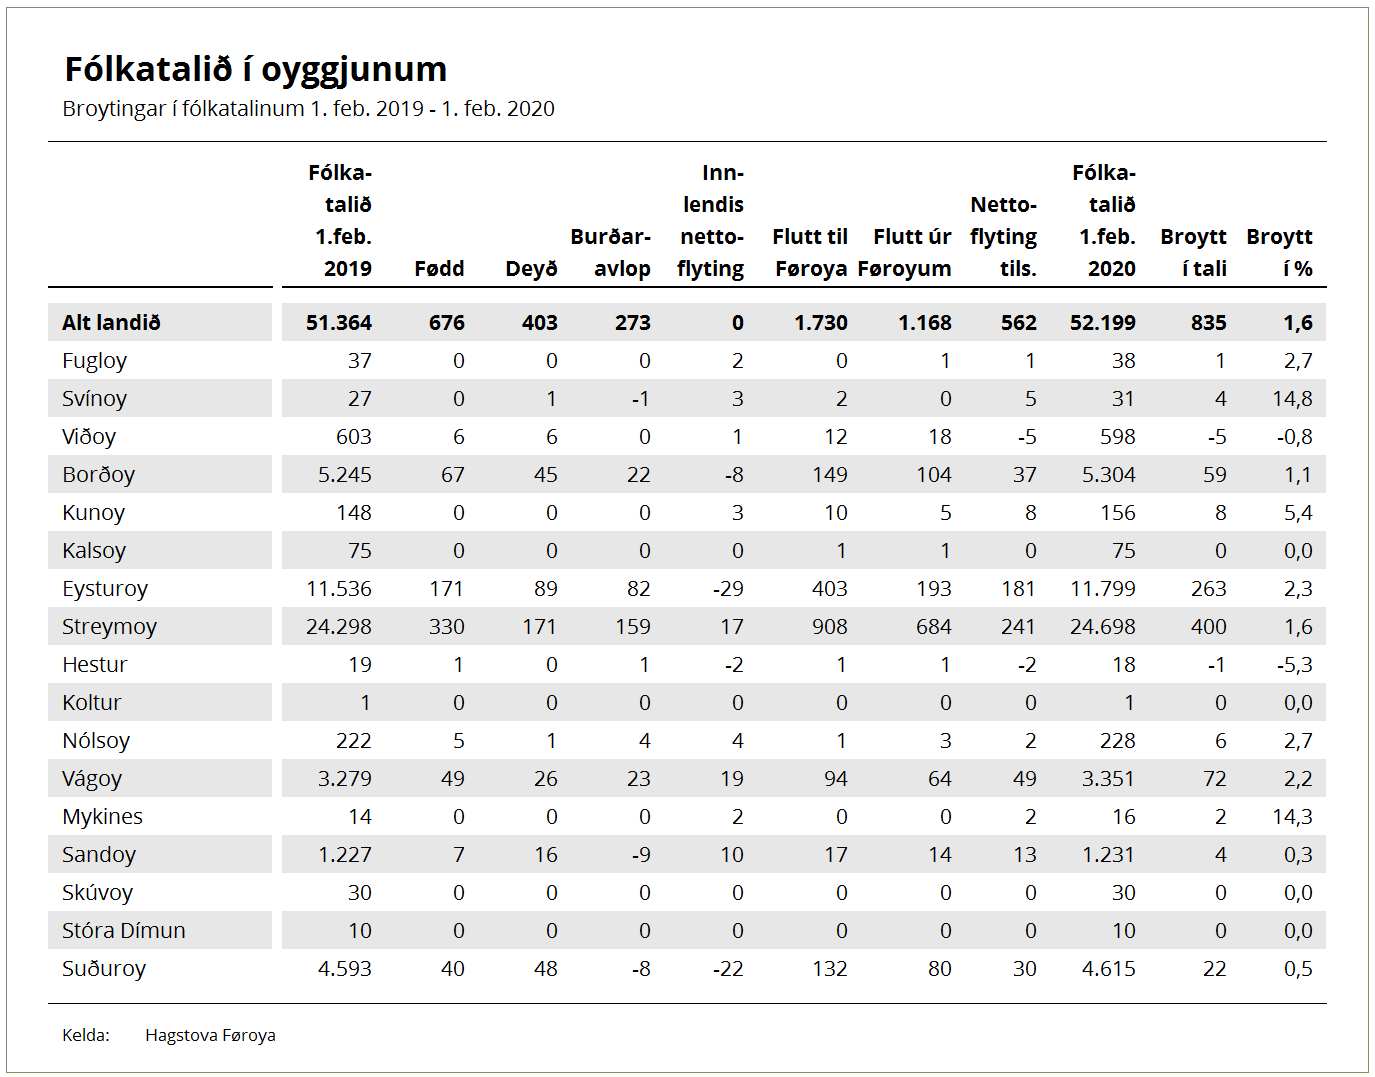
Biggest growth in the central region
Geographically, all regions saw population growth, but there are large differences between them. In numbers, the biggest growth (366) was in the capital region and in Eysturoy (263).
The capital region has traditionally had the biggest population growth, but relative to each region’s population, Eysturoy and Vágar now have larger relative population growth.
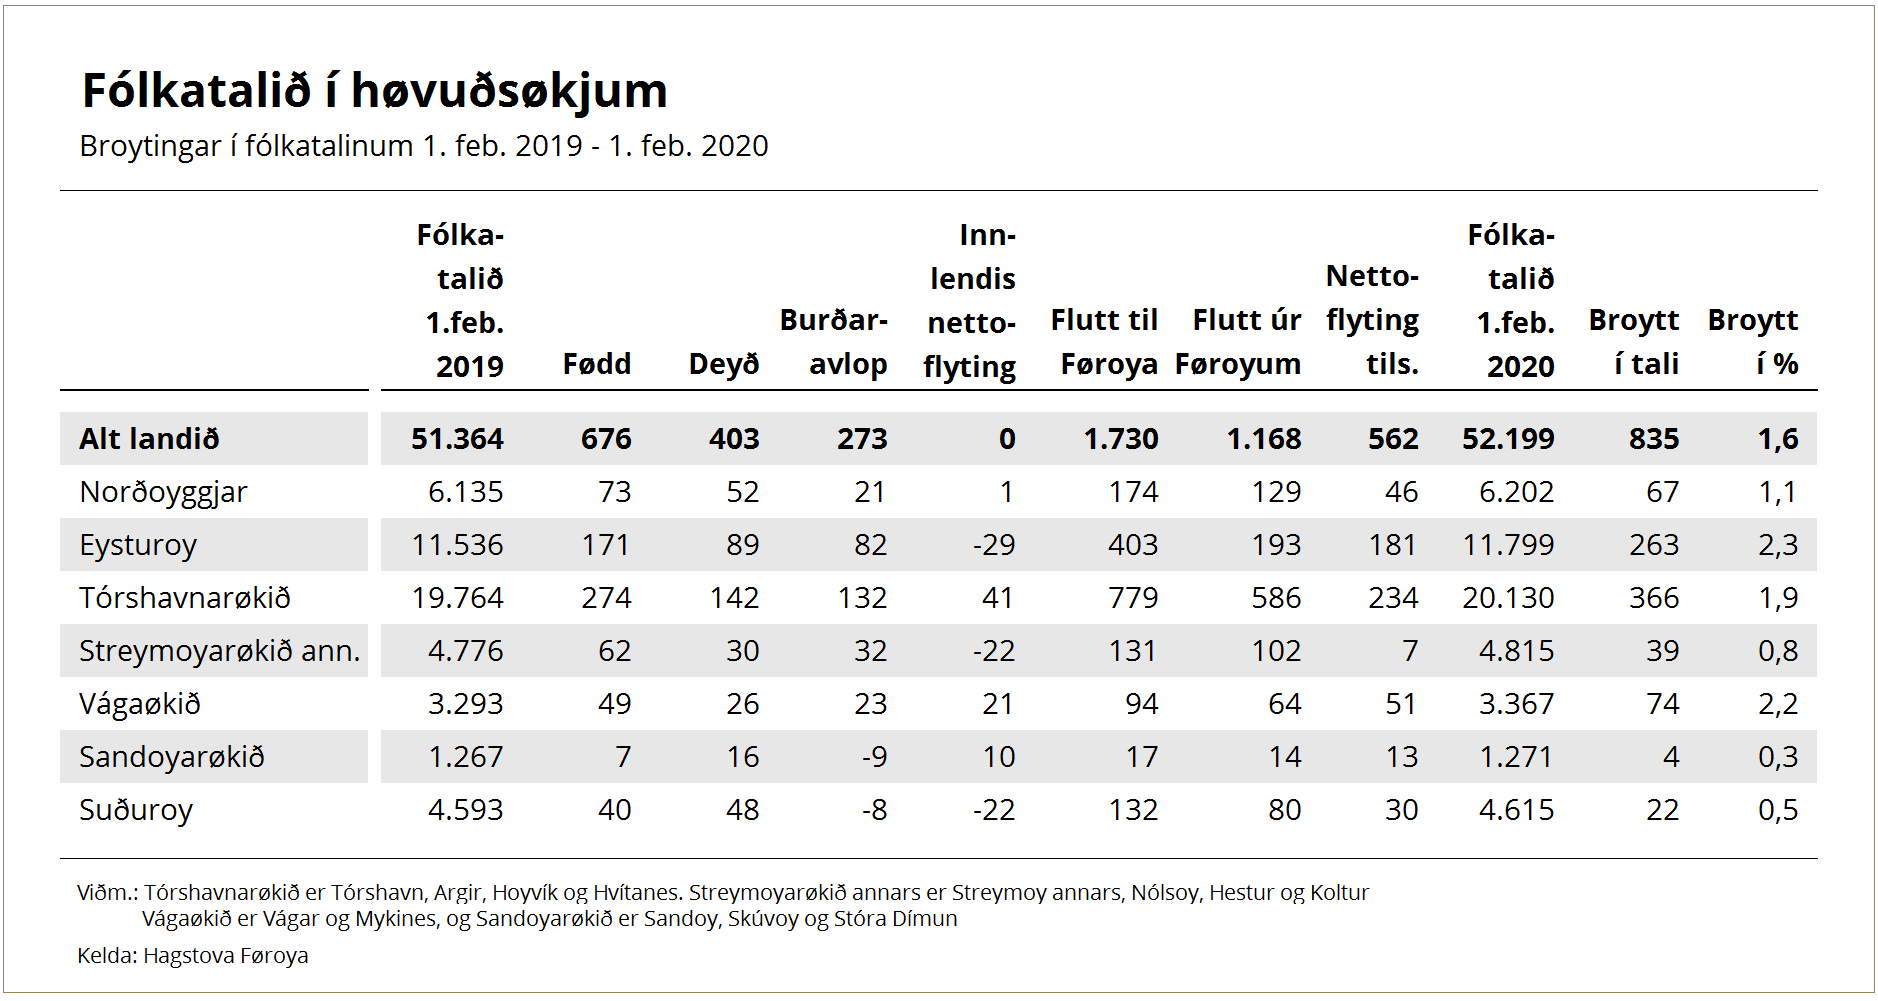
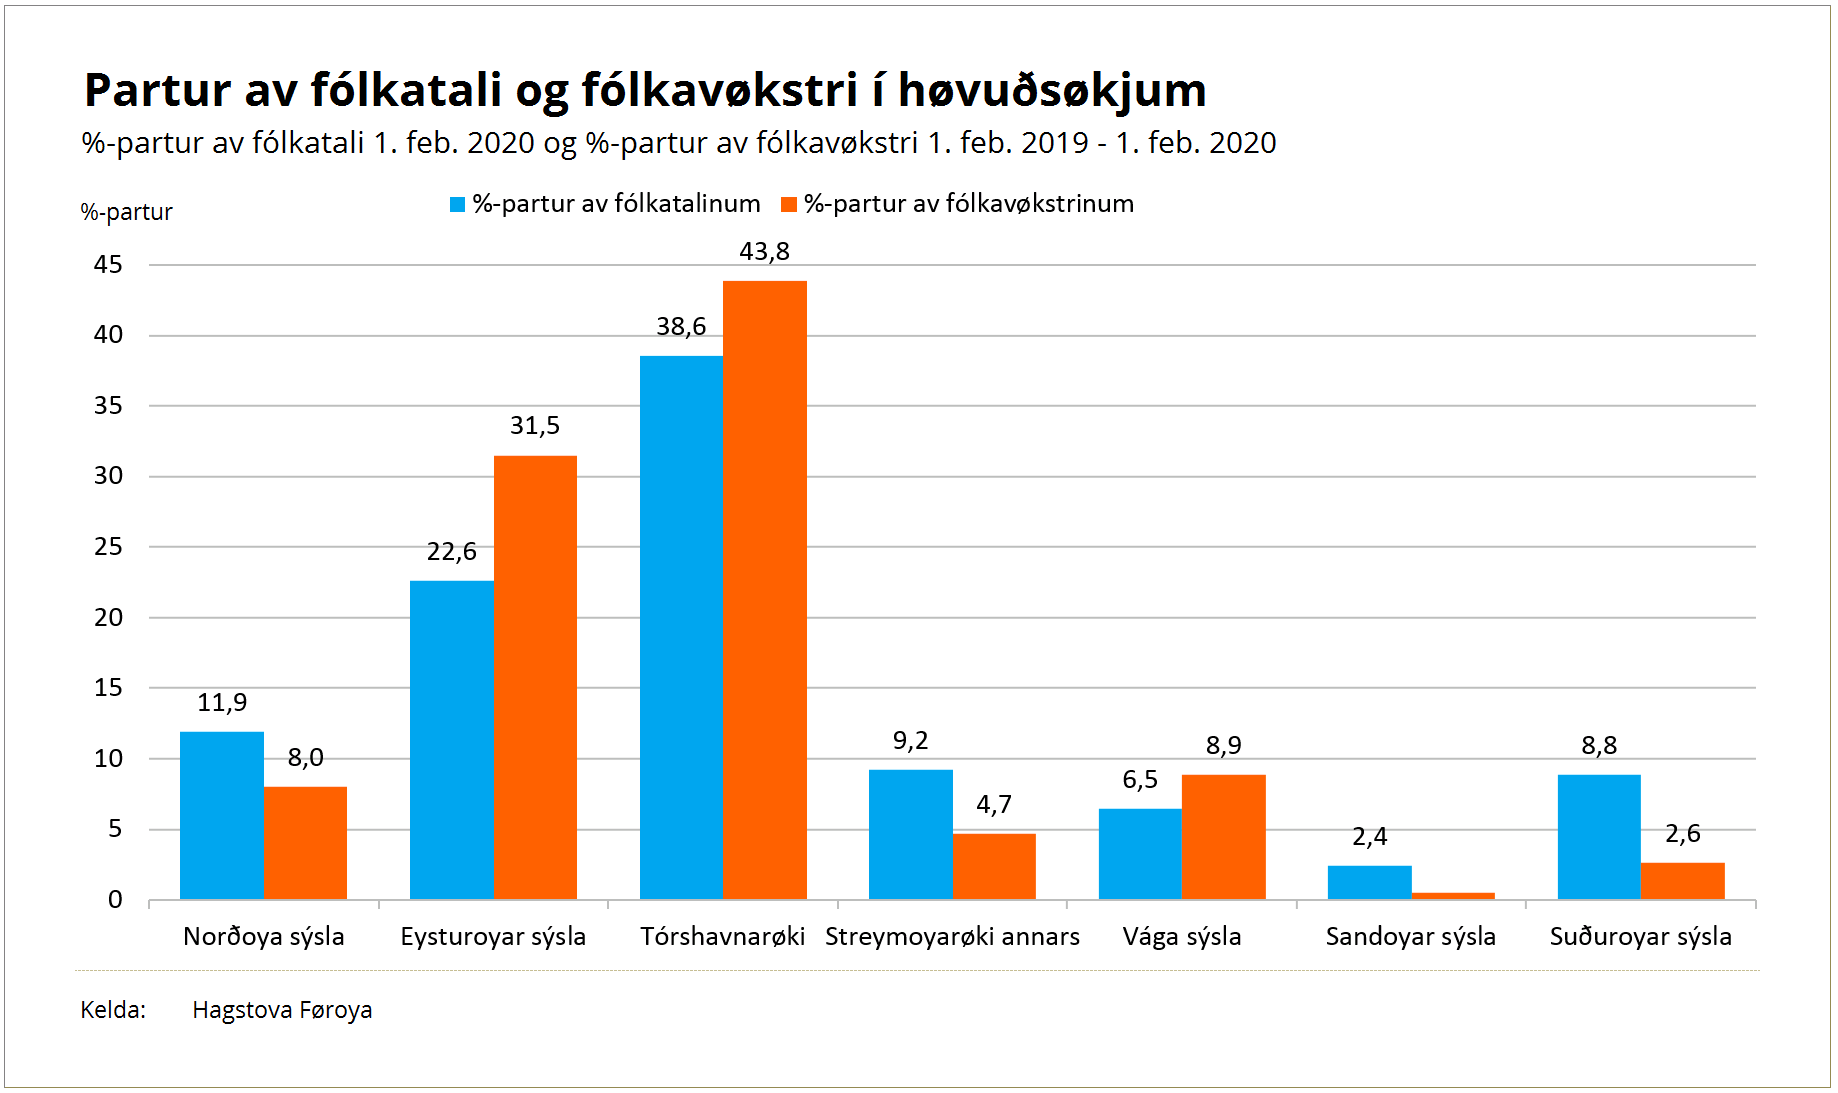
Just under 23% of the country’s population lives in Eysturoy, but the increase of 263 people corresponds to almost 32% of the total growth.
In comparison, almost 38% live in the capital region, which had a growth of 366 people, almost 44% of the total growth figure.
Norðoyggjar have 12% of the total population, but this region’s growth only represented 8% of the total growth.
Vágar are home to almost 7% of the population, but this growth represented 9% of the total growth.
Suðuroy has 9% of the population, but this growth only represented 2.5% of the total.
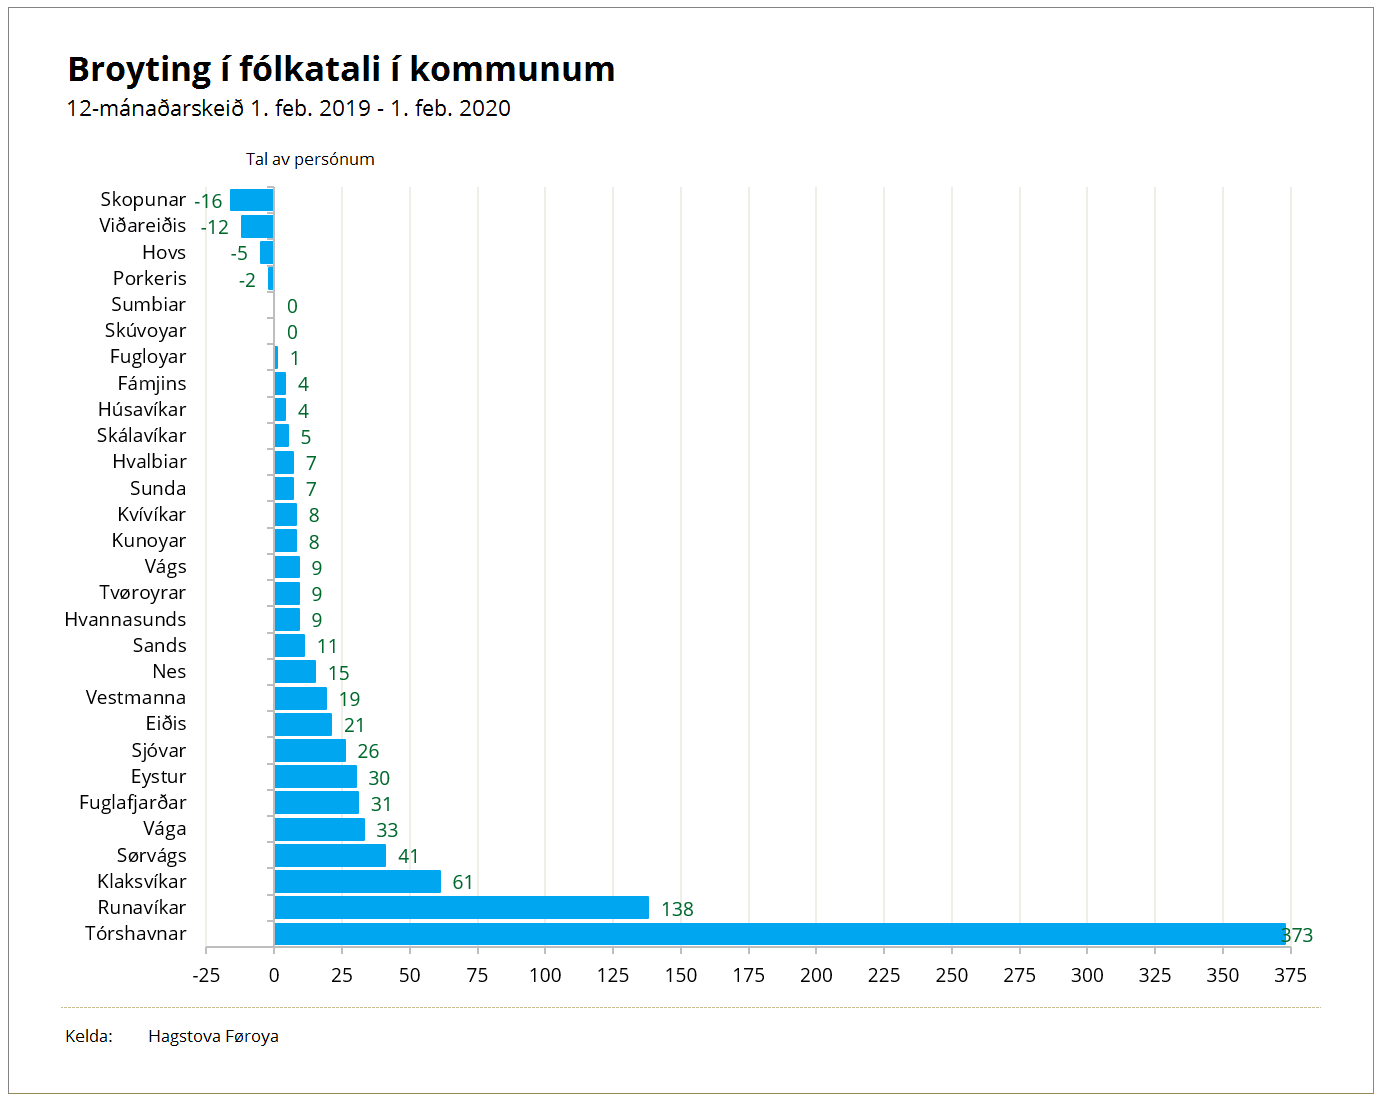
Municipalities
Grouped into municipalities, the figures show by far the greatest increase in Runavík (3.4%) and Tórshavn (1.7%) municipalities.
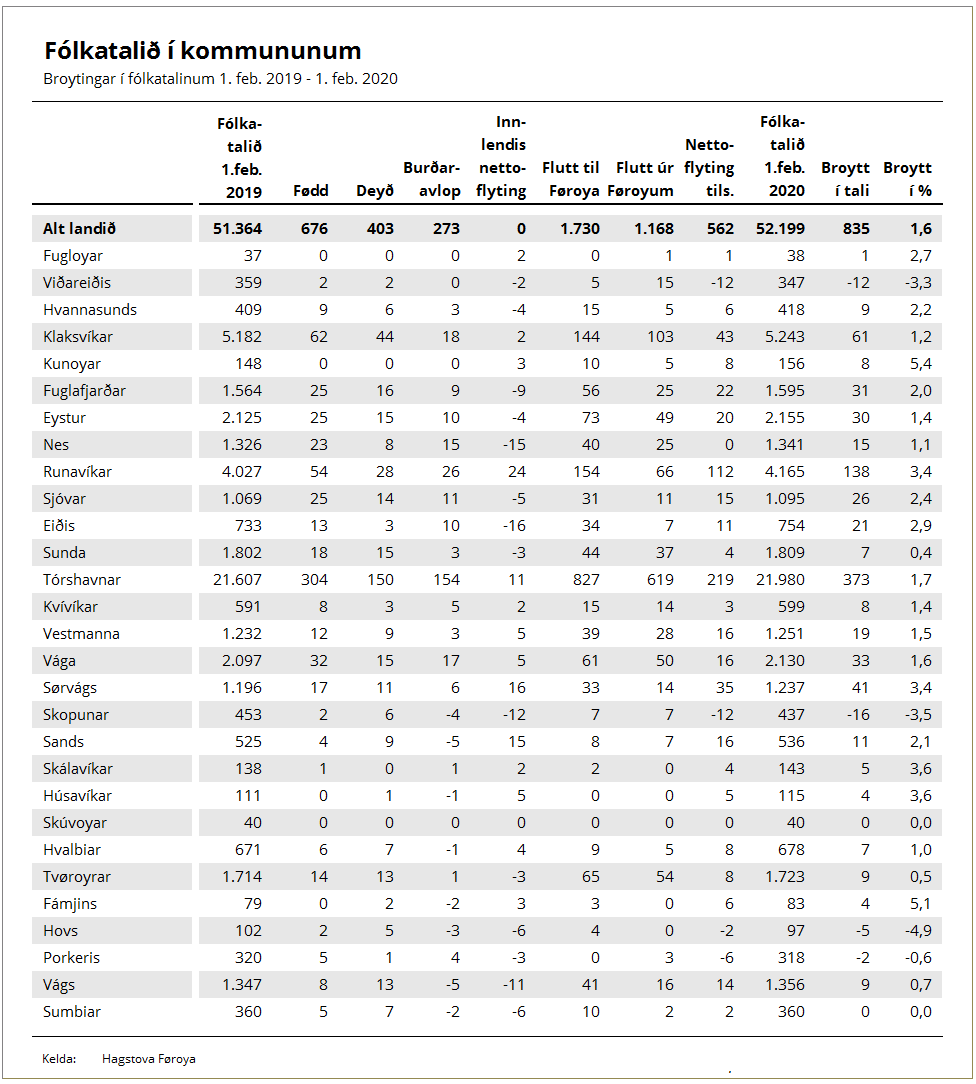
All in all, 23 municipalities saw an increase in the population, 2 saw no change and 4 had a reduced population.
Islands
All the larger islands saw an increase in their population. Of the smaller islands, Svínoy, Kunoy and Nólsoy had a large proportional growth. Hestoy and Viðoy are the only islands that had a dwindling population in the last 12 months. Skúvoy and Stóri Dímun had no change.
Figures have a one-month lag
The figures have a one-month lag due to delays in registrations, especially regarding address changes, where many registrations are made after the month of address change has ended. To accommodate as many corrections as possible, there is a one-month lag in the data.
About the population figures
The population is defined as all individuals registered in the national register as residents of the Faroe Islands. Population data includes date of birth, gender, place of birth, citizenship, relationship status, and, where applicable, information on immigration and emigration, domestically as well as between the Faroe Islands and other nations.
About the trend
The trend describes the population trend by adjusting for seasonal effects and other error components in the population figure.