Population
04. Mar 2022
Average age up by 6.5 years since 1985
Despite this increase, the trend in the period from 1985 to 2021 does not indicate a steady growth. During the first ten years of this period, the average growth rate was at 3 years, with the financial crisis in the early 1990s having a particular effect, as many young people emigrated.
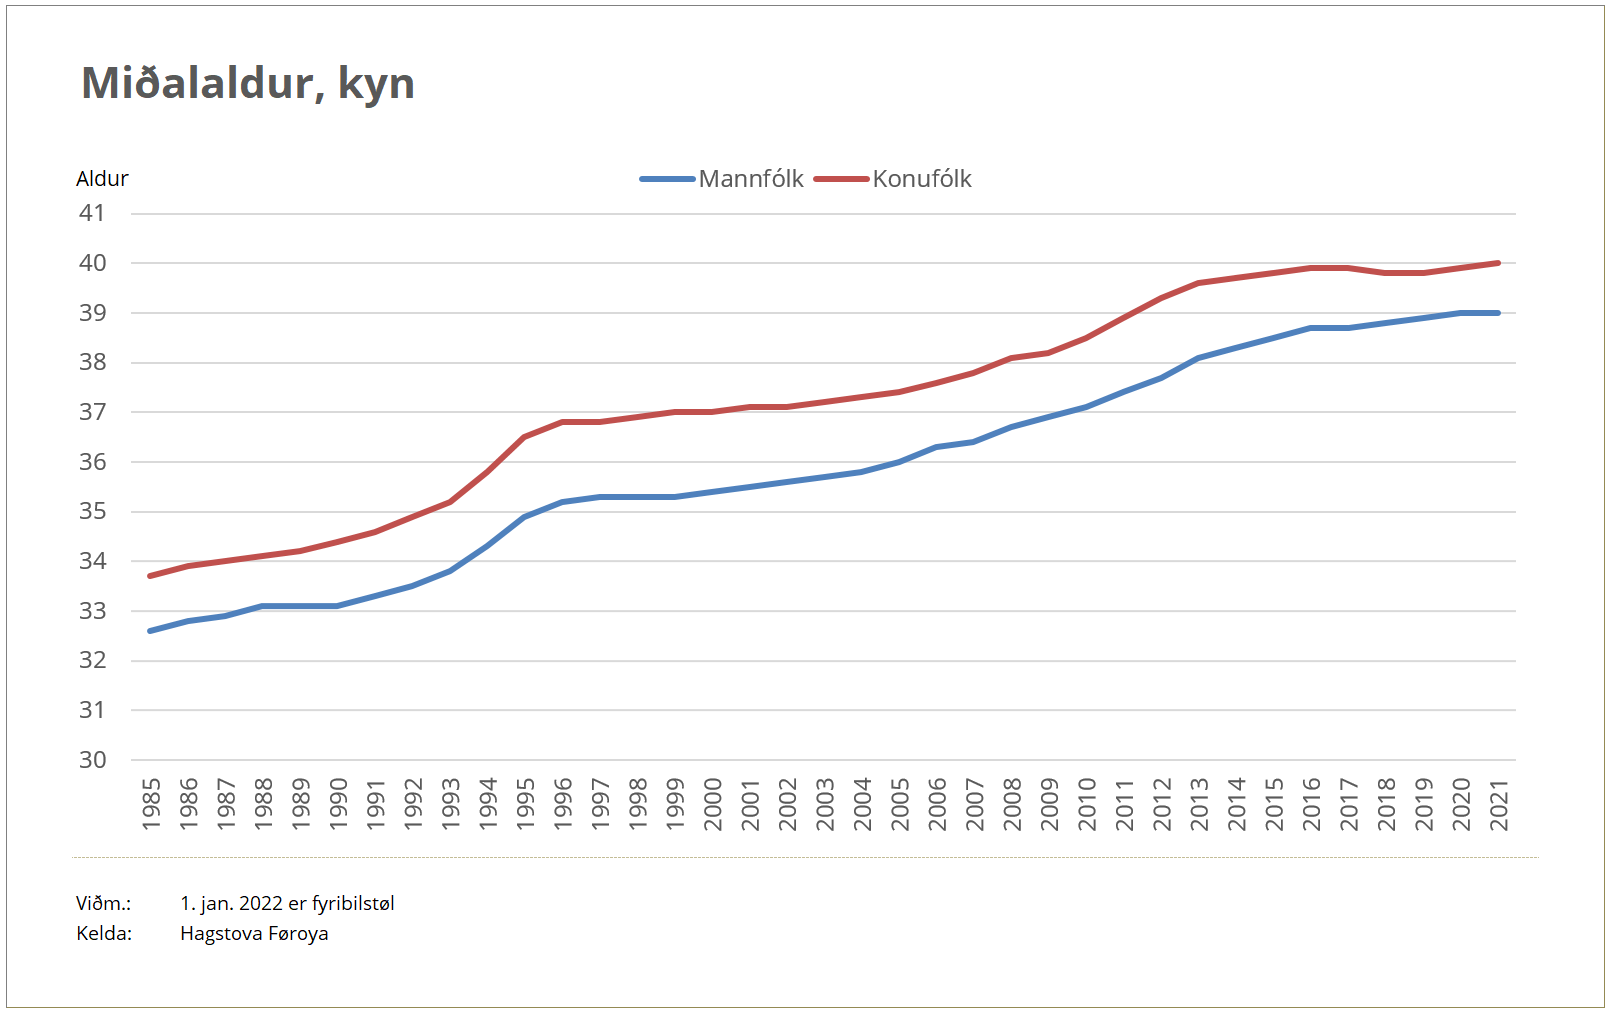
As the graph above shows, the trend for the average age from 1985 to 2022 is similar for men and women. The average age discrepancy between men and women of approx. one year has remained the same since 1985.
The average age of the Faroe Islands saw its biggest spike during the financial crisis of the early 1990s, as thousands of Faroese families and young adults emigrated.
The following 12 years saw a rather steady trend, before the financial crisis in 2009 led to an increase in emigration and, consequently, the average age increased. In 2014, the high emigration figure was countered by a rising year-on-year immigration figure, slowing down the average age growth, particularly amongst women.
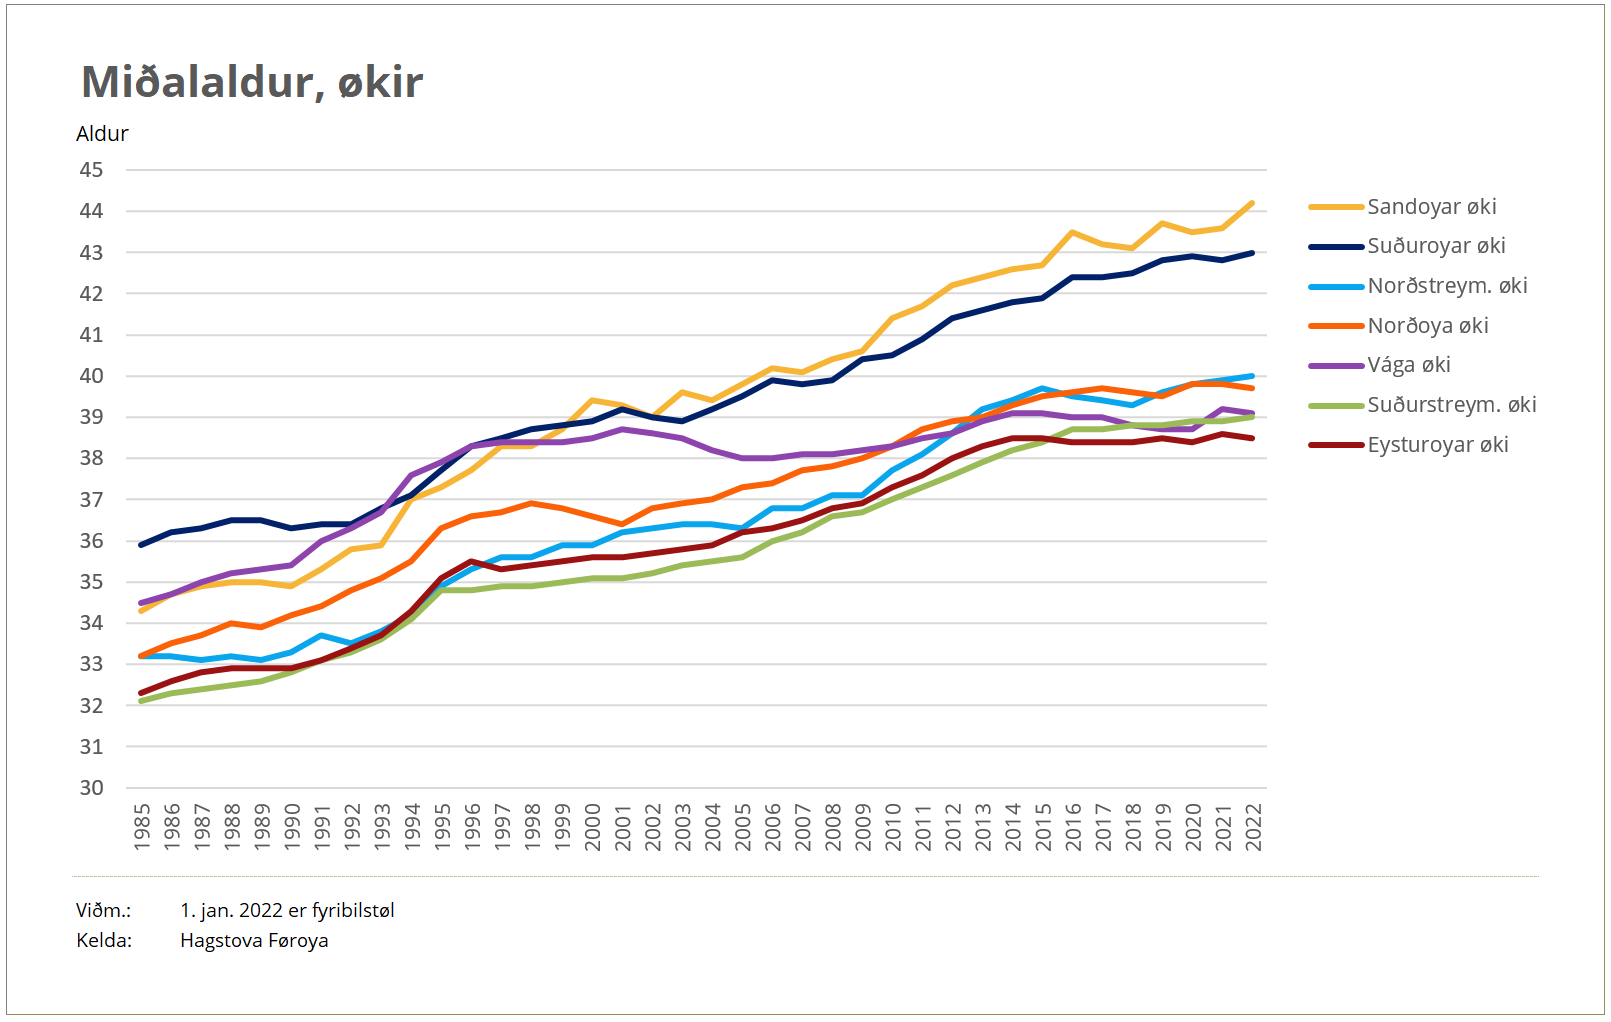
Biggest increase in the southern region, lowest in the central region
The average age trend differs significantly across the main regions. Eysturoy, Suðurstreymoy, Norðstreymoy and Norðoyggjar have a similar trend, with Eysturoy and Suðurstremoy scoring the lowest average age.
The average age trend in Vágar differs from the rest of the main regions. Vágar scores a high average age up until the end of the 1990s, followed by a period up to the present during which the average age is low.
In the period from 2000 and onwards, the Sandoy area and Suðuroy stand out with the highest average age.
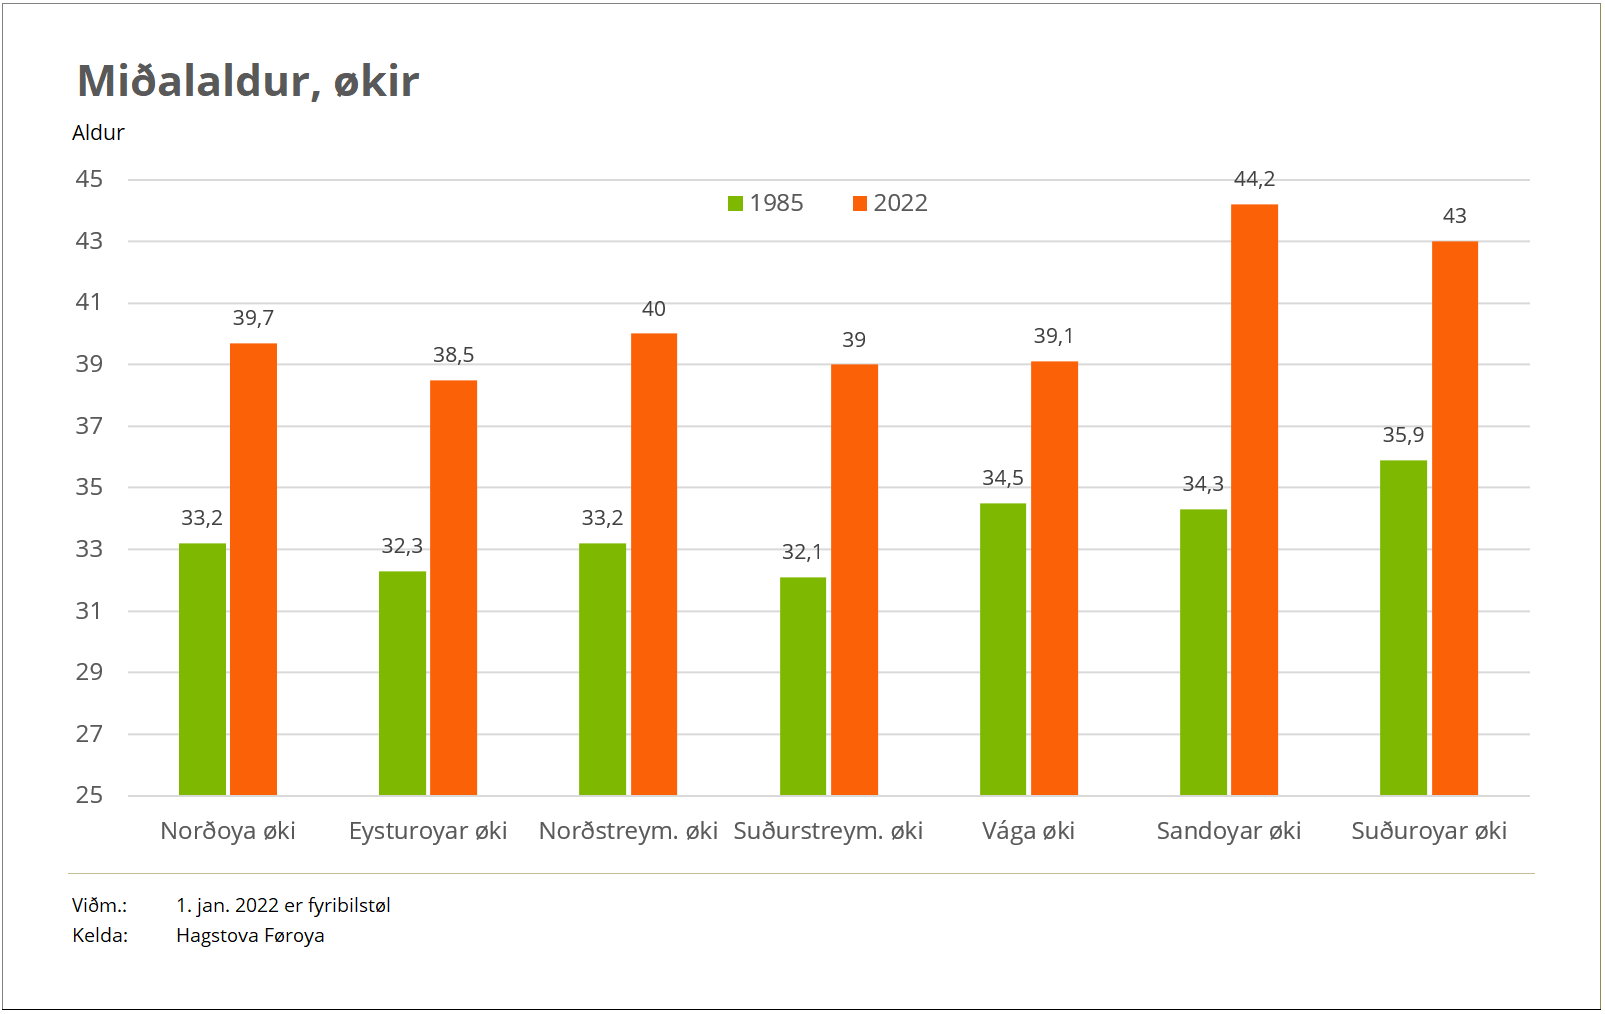
The difference in the average age across the regions is especially visible in the graph above, which compares the average age figures from 1985 to 2022. For instance, the average age in the Sandoy area increased by 10 years, which is double the that of the Vágar area. The lowest average age in the Faroe Islands is in Eysturoy and the Suðurstremoy area, both in terms of 1985 and 2022.
Drastically changing age distribution
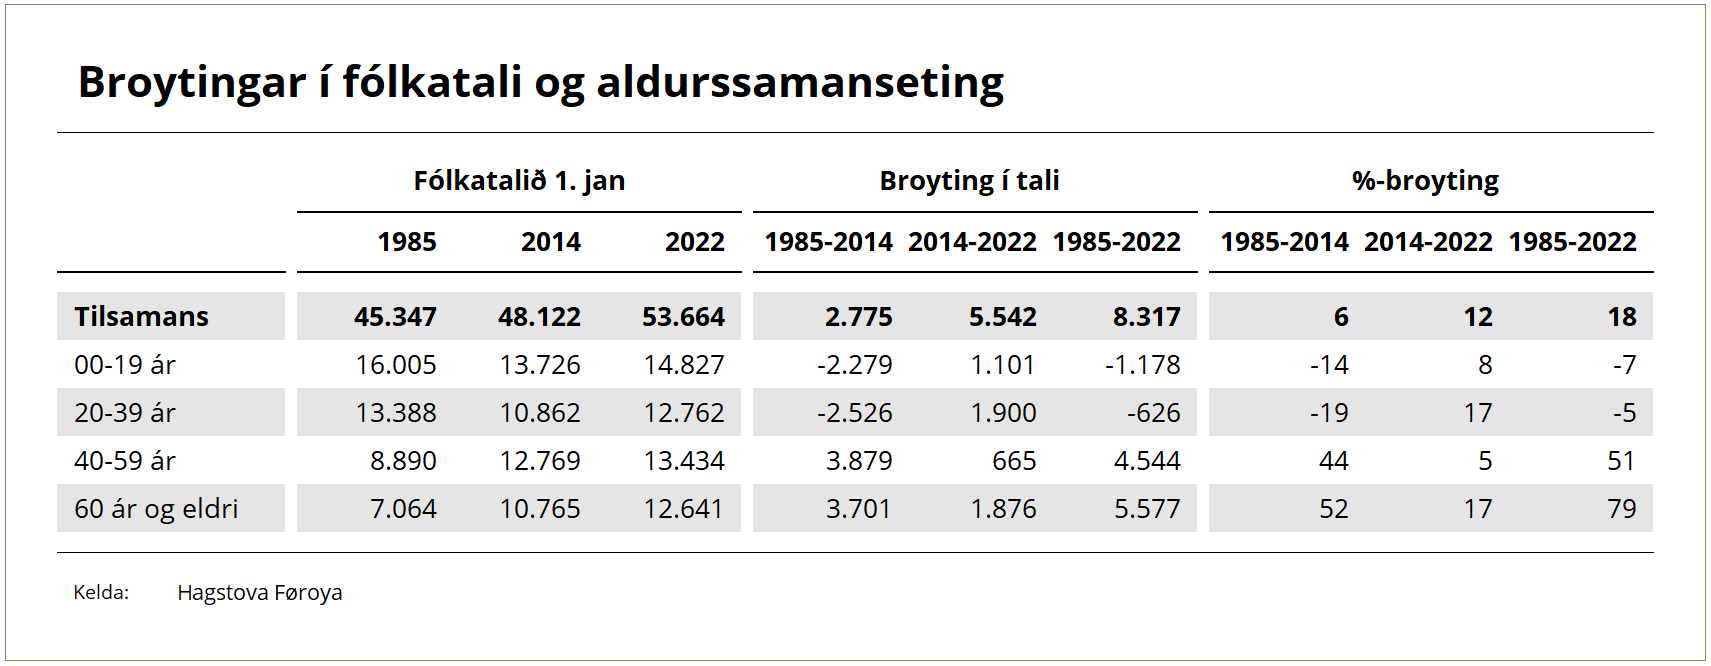
The cause of the spike in the average age is the changing age distribution. In the period 1985 to 2022, the total population of the Faroe Islands increased by over 8,300 people.
This period has seen a drastic change in terms of the age distribution. This is especially visible in the table below, which shows the gradual changes in the four age groups. Comparing 1985 and 2022, the age group under 40 has decreased by approx. 1,800 people, while the age group 40 or over has increased by more than 10,000 people.
The situation has changed significantly during in past eight years. The table below shows an increase in the total population of more than 5,200 people, with the youngest generations seeing the biggest increase. During the past eight years, the age group under 40 increased by approx. 3,000 people, while the age group 40 or over increased by 2,500 people.
What causes the changing age distribution?
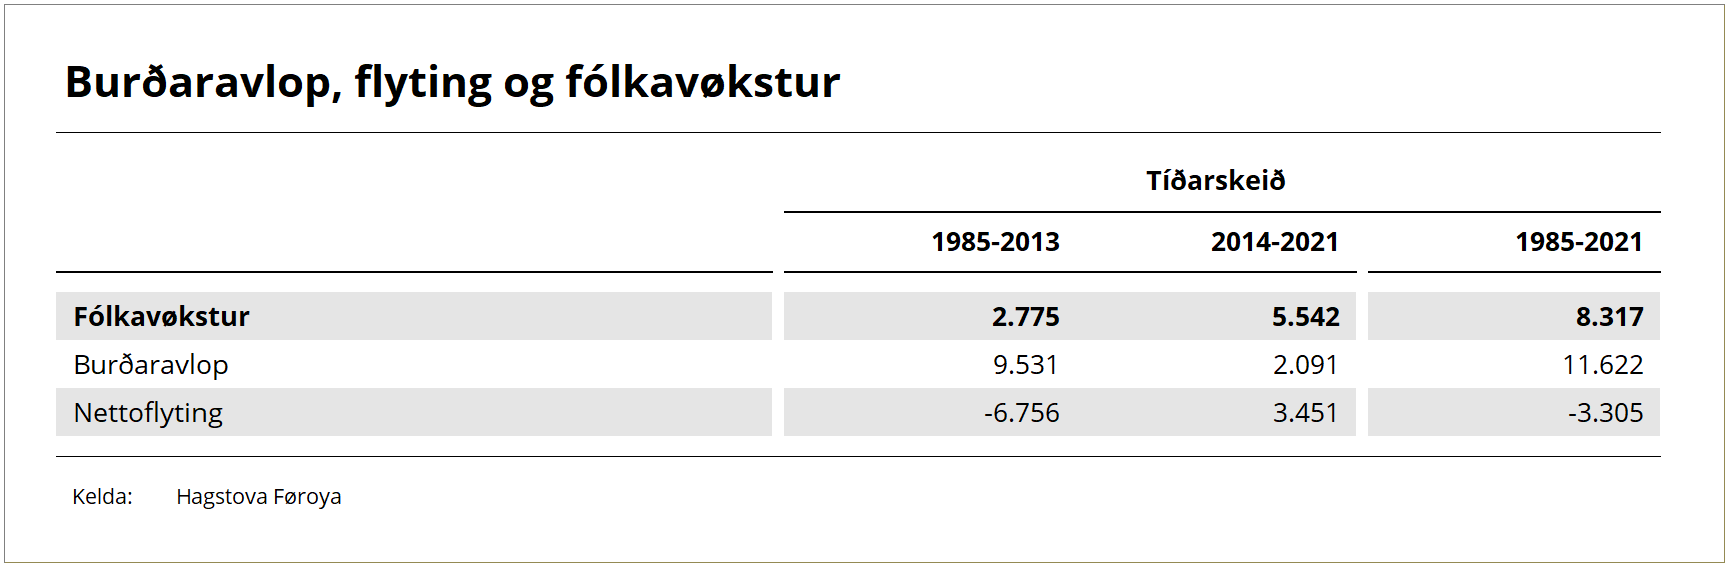
The population trend is determined by net migration figures and the excess of births over deaths.
In the period 1985 to 2022, a population increase of more than 11,600 people is due to excess of births, while a decrease of 3,300 people is due to net migration.
During this period, there were some factors that had a drastic effect on the population trend, the financial crisis in the beginning of the 1990s being by far the most significant. The crisis in the early 1990s was followed by a 10-year period with relatively positive growth, until 2003/2004. Then followed a 10-year period of stagnation and economic downturn, before the trend reversed to strong progress with rising immigration and population growth, which has remained during the past eight years. As the table below shows, the contribution of excess births to the total population is 2,100 people, and the contribution of net migration is just under 3,500 people.
Hence, during the past eight year period, the average age has not spiked as it has in previous periods.
How has the age distribution changed in the main areas?
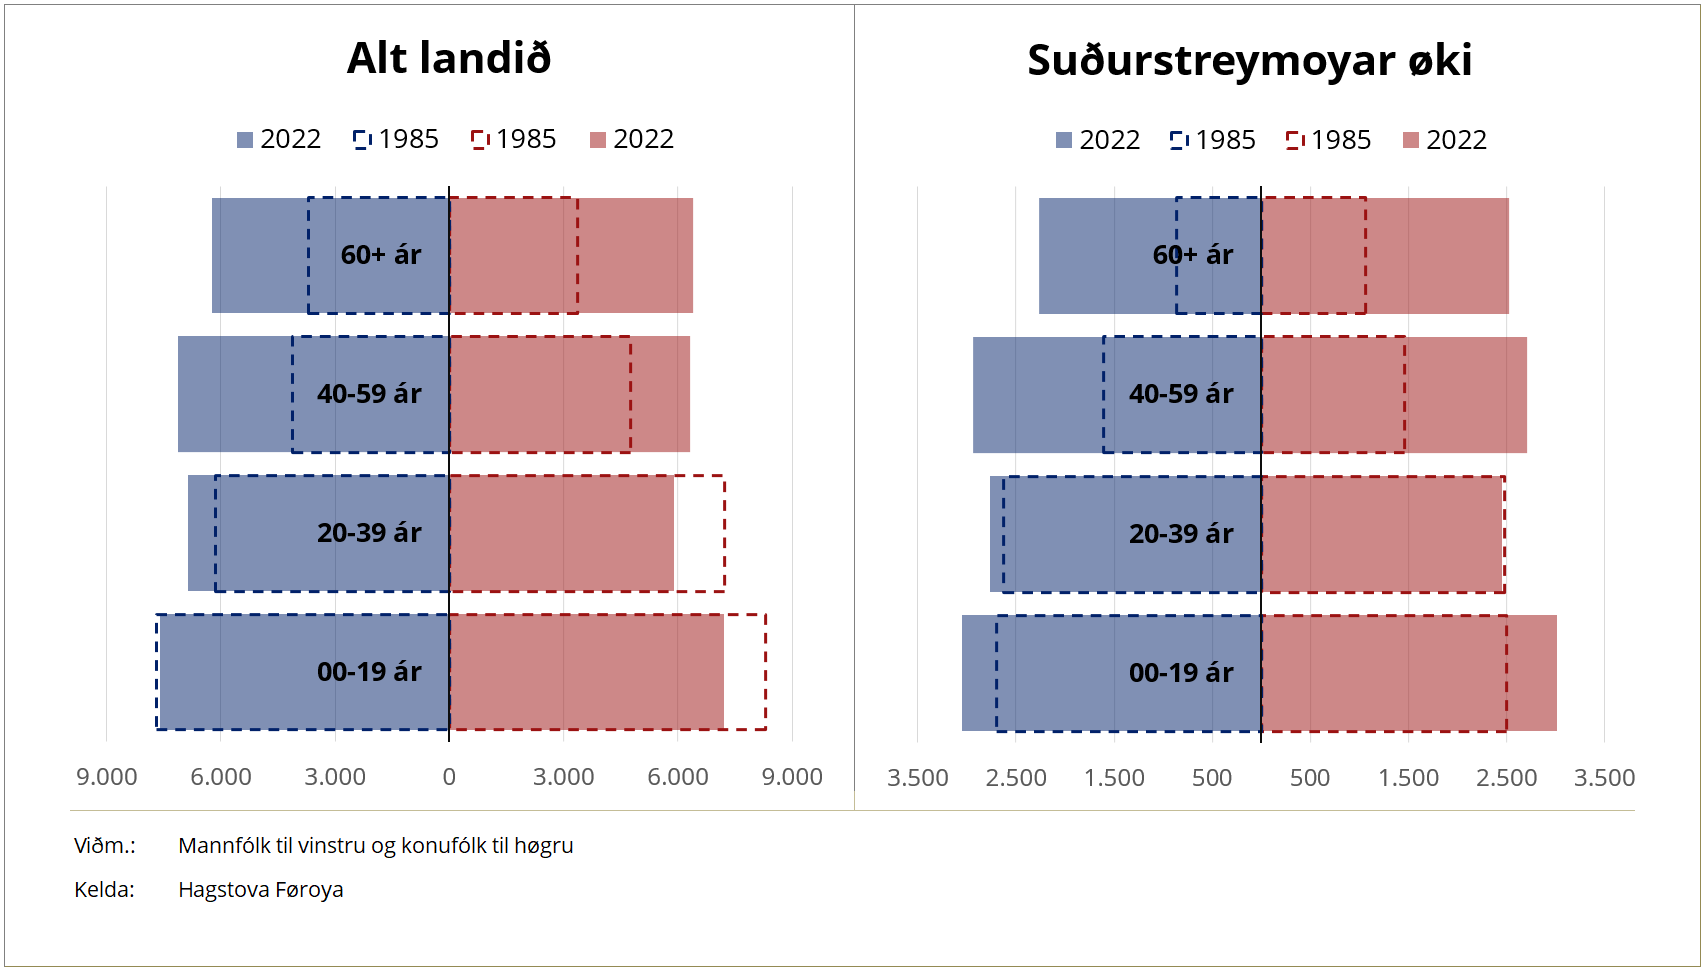
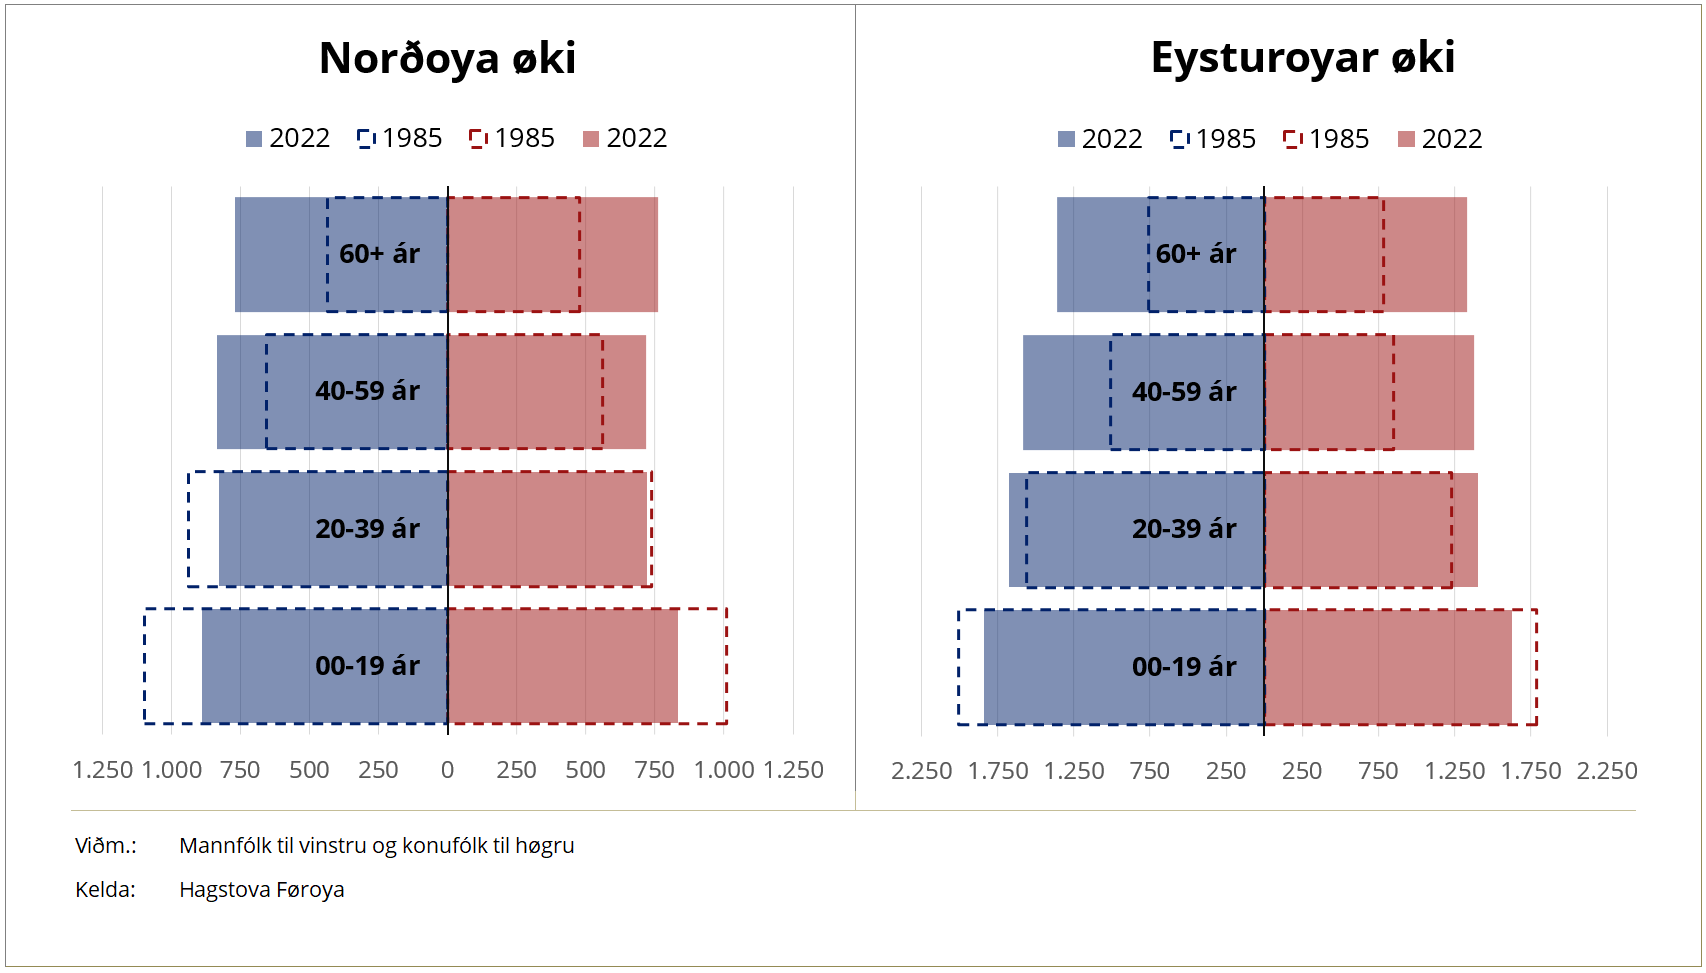
A so-called age pyramid is a way of depicting the age structure of a population. The pyramids below show the age distribution in 1985 and in 2022. The youngest age groups are represented in the bottom of the pyramid, while the oldest age groups are seen in the top.
The original pyramid shape has completely changed in line with demographic shifts during the past many years. In the present day, we see that the youngest segments in the bottom of the pyramid have shrunk, while the oldest age groups in the top gradually expand, in some cases matching or exceeding the youngest age groups. This is a global trend, caused to a large extent by increasing life expectancy and decreasing adolescent birth rates. In the Faroe Islands, the adolescent birth date is high in comparison with European countries, though it is the emigration that especially impacts the shape. Thus, even though the pyramid shape in the Faroe Islands resembles that of other countries, the pyramid shape is in fact caused by numerous factors.
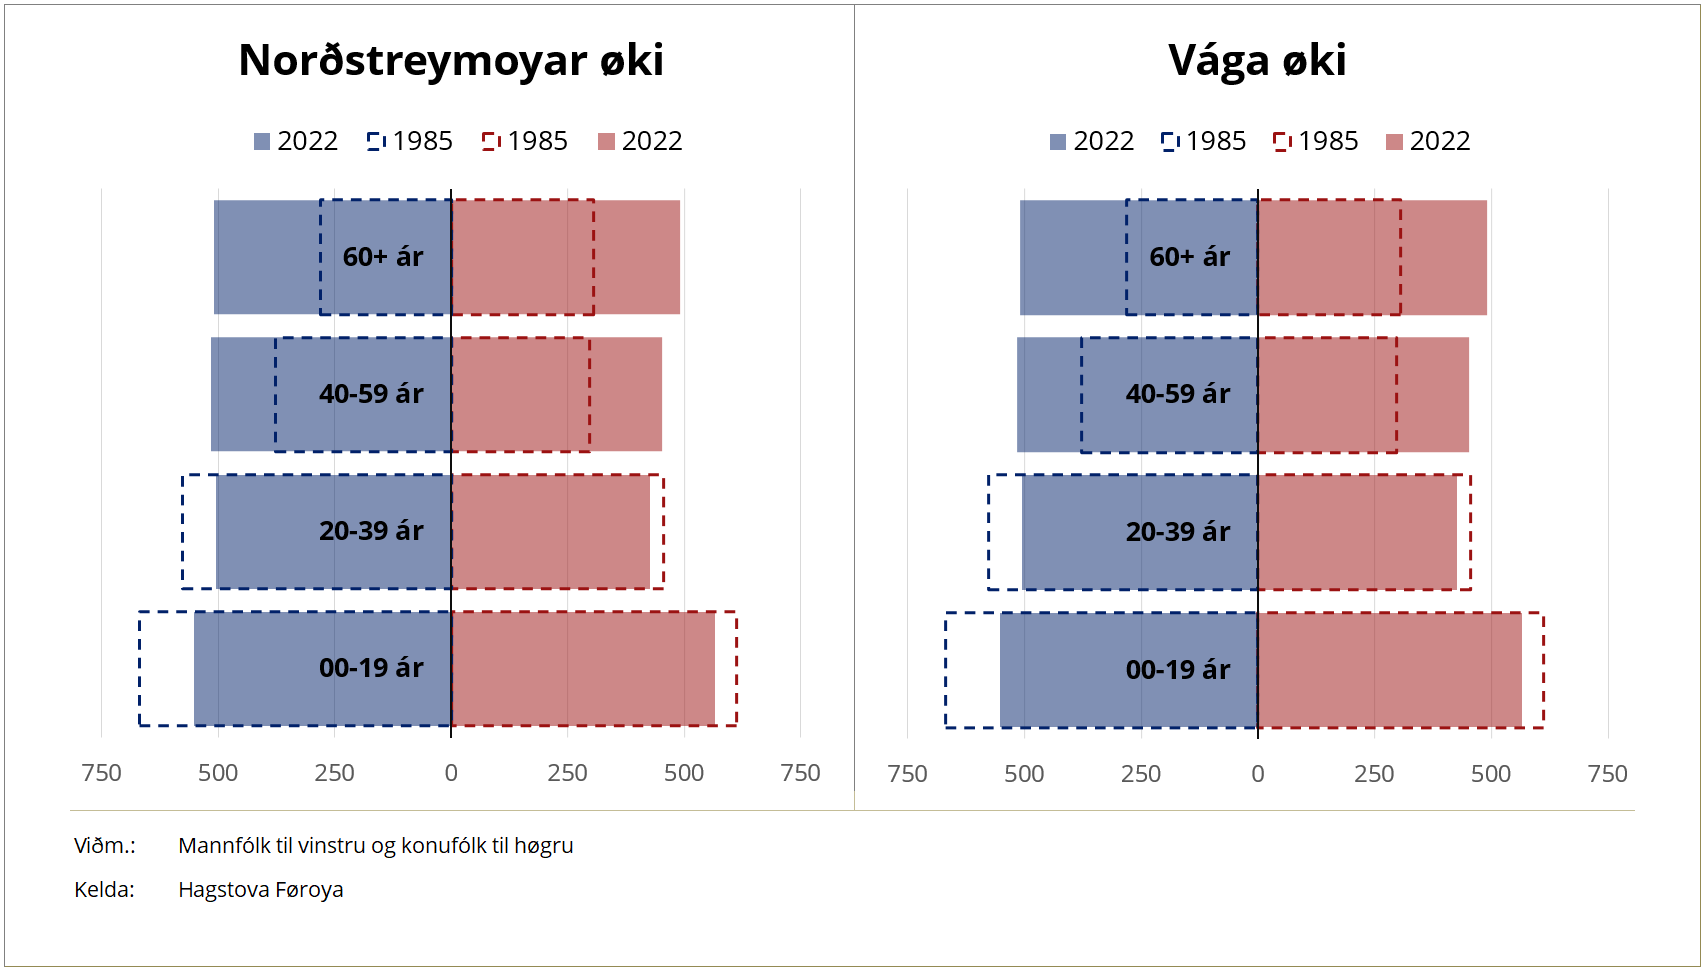
The way in which this global trend affects the population structure differs from country to country, so too in between the areas of the Faroe Islands. The differences between the main areas in the Faroe Islands are shown in the age pyramids below, comparing 1985 with the situation today.
In all of the main areas we see a slight decrease in terms of the younger generations, and a significant increase in terms of the older generations, though this has not had an effect on the sex distribution. The trend in Suðurstreymoy resembles the trend for the total population, as Suðurstreymoy is the most populous area in the country.
However, there is a main difference to be seen between Suðurstremoy and the rest of the main areas, namely that Suðurstremoy is the sole area during this long period with growth not only amongst the oldest generations, but also amongst the youngest generations.
In Norðoyggjar, the age pyramid has shifted significantly from 1985 to the present. The youngest age groups have shrunk significantly, and the oldest age groups have grown to a large extent. The age distribution in Eysturoy remains the youngest in the country. Here, the age group 20-39 is on the rise, along with the older age groups. Thus, Eysturoy has retained its pyramid shape, being widest in the bottom and gradually tapering upwards.
In Norðstremoy, most of the pyramid shape has faded, although the bottom, represented by the youngest age group, remains the largest. Otherwise the pyramid has turned upside down, becoming gradually wider from the age group 20-39 and towards the top.
The age pyramid in Vágar resembles that of Norðstreymoy, although here, the growth amongst women in the younger generations is noteworthy.
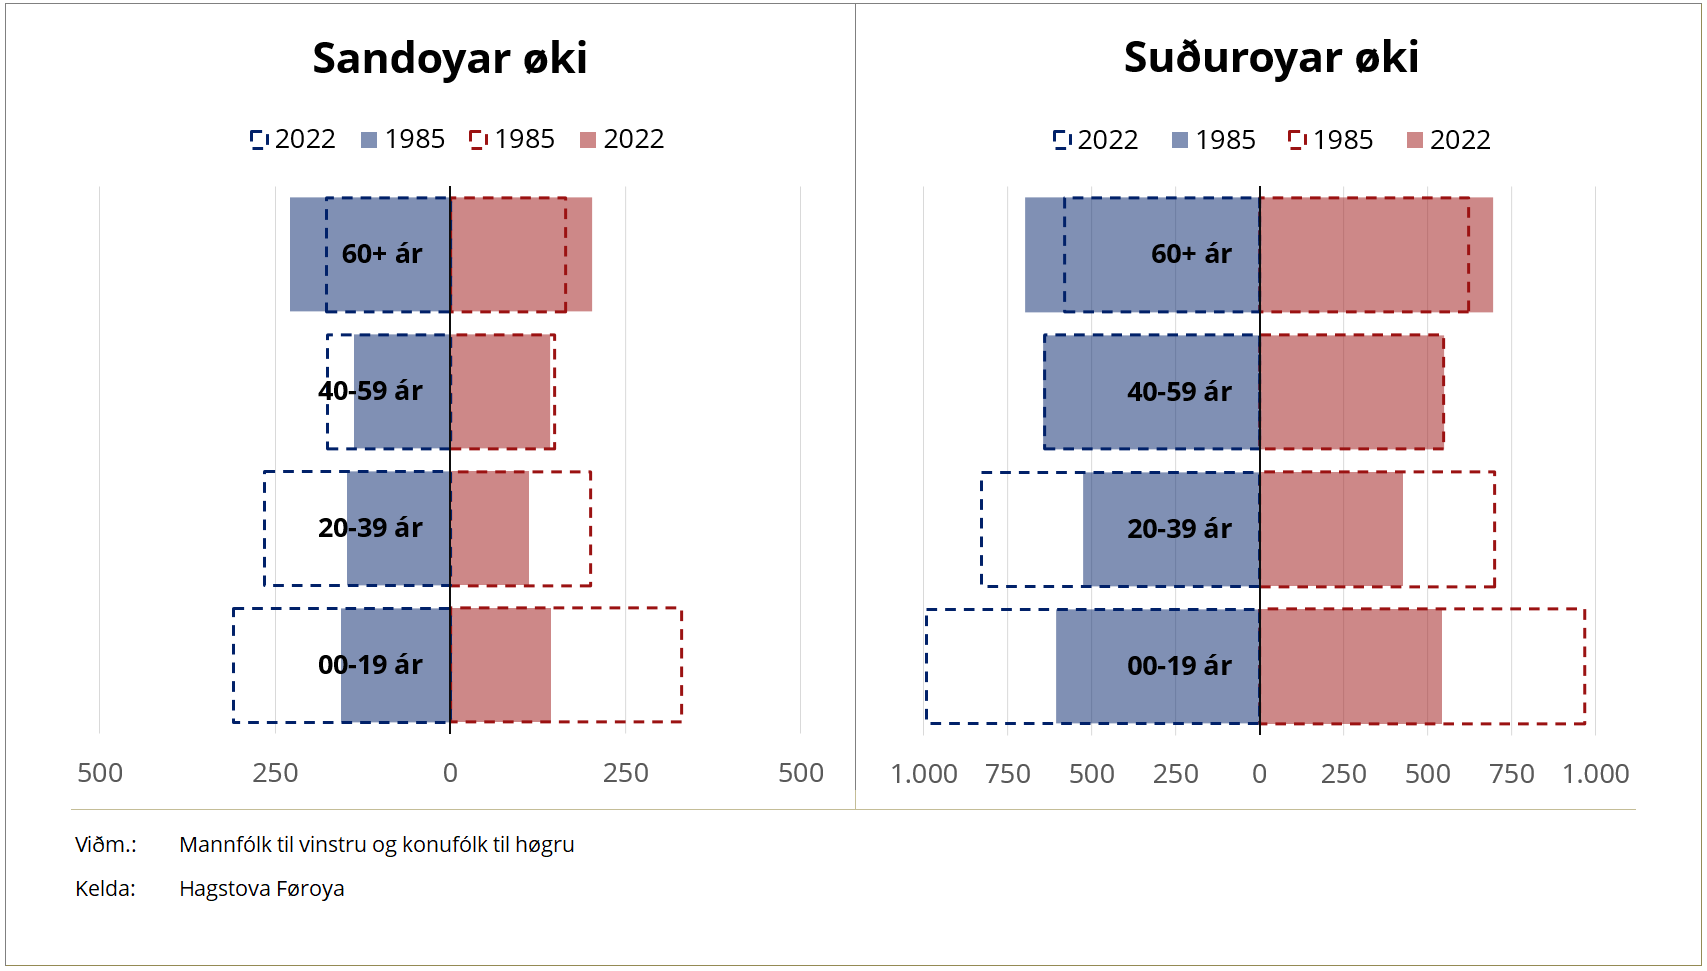
In terms of the demographic trend, the population trend and the structure of the Faroese population, the recurring conclusion is that the two areas, Sandoy and Suðuroy, stand out.
The age pyramids below, representing Sandoy and Suðuroy, are completely turned upside down. The older generations are the most populous, and the pyramids taper downwards towards the younger age groups. This is an alarming trend, as the age group 20-39, which is meant to reproduce and further the population, is the smallest age group. A small improvement can be found in the fact that the very youngest age group, having not declined to the same extent, can improve the overall picture.