
Births
24. Apr 2025
Fertility rate improves slightly but remains below 2

The Faroese fertility rate has averaged around 2.5 children per woman of childbearing age since the start of this century. However, this has changed significantly in recent years. In 2016, the fertility rate was 2.64, dropping to 2.43 in 2019, 2.07 in 2022, and in 2023 it fell below 2.0 for the first time. This is a big decline over a short period. However, the 2024 figures represent a break of trend as the rate increased year-on-year, from 1.86 in 2023 to 1.91 in 2024.
[px-graph-1]
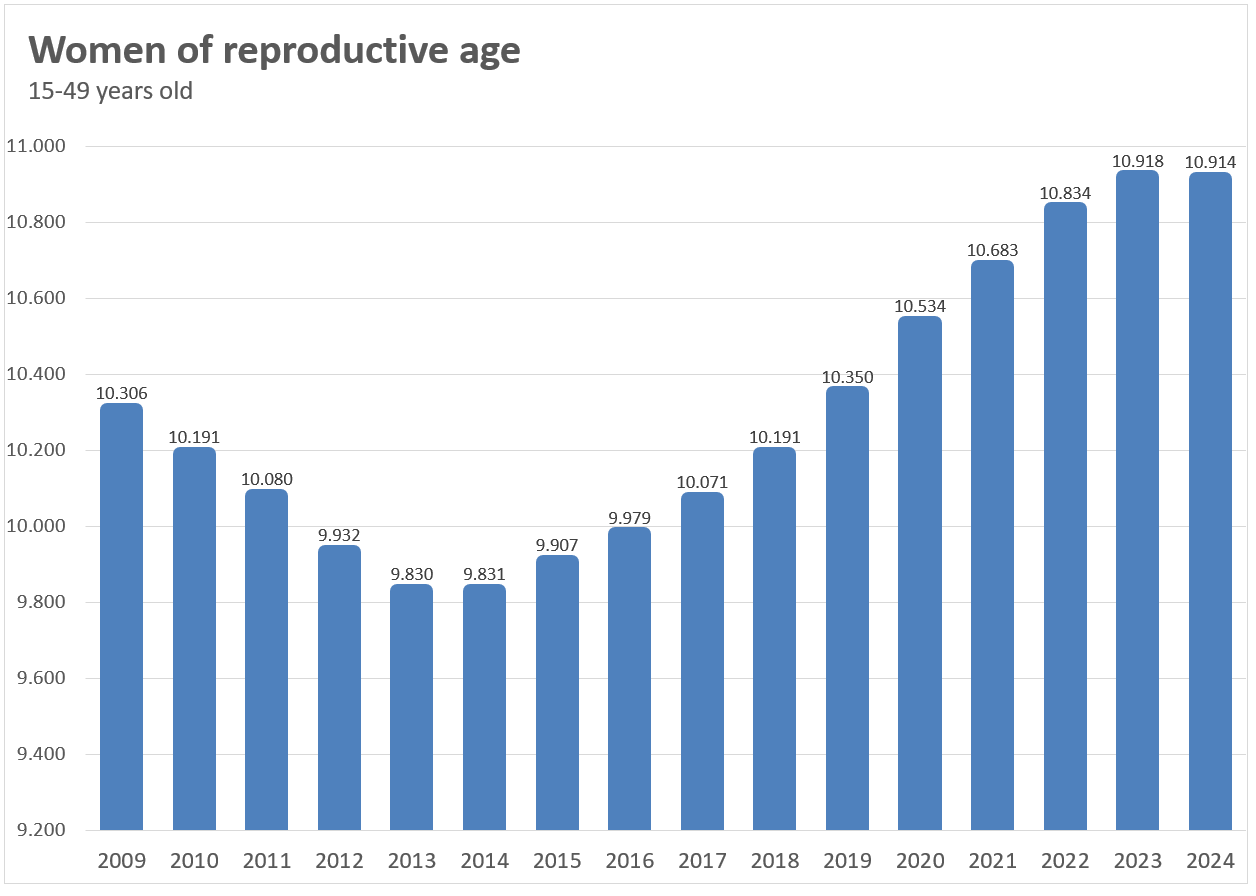
More women but fewer births
The fertility rate is a ratio between the number of children and the number of women of childbearing age. The fertility rate trend can thus also be described by looking at the trends in the number of women and live births.
The slight increase from 2023 to 2024 is reflected in a slight increase in live births and an almost unchanged number of women.
The number of women of childbearing age has increased by more than 1,000 in the period from 2013 to 2023. However, despite this increase of women, the number of births has remained relatively stable. After a steady annual average of about 680 children from 2016 to 2021, the number fell to 632 in 2022 and 574 in 2023. The 586 number for 2024 is a slight increase on 2023, but still well below figures from previous years.
[px-graph-2]
Changes in age-specific fertility rates
The total fertility rate is composed of age-specific fertility rates, i.e. fertility rates in the various age groups.
Although the total fertility rate has been stable up until a few years ago, age-specific fertility rates have seen a long-term change. Age-specific fertility rates for women below 30 have fallen significantly compared to the 1970s and 1980s. Since 1970, the highest fertility rate has shifted from women in the 20-24 age group to women in the 30-34 age group. This shift is largely due to the fertility rate in the 20-24 age group falling steadily to about a quarter of what it was in 1970.
The chart below shows changes in age-specific fertility rates across 5-year age groups since 1970.
[px-graph-3]
The total fertility rate is defined as the average number of children that would be born to each woman aged 15-49. The total fertility rate is calculated as the number of children that 1,000 women would have given birth to in their lifetime provided that throughout their entire childbearing age they give birth to the same number of children as the fertility rate for the year in question and that none of them die before they turn 50.
A total fertility rate of at least 2.1 children per woman is required for a population to increase, assuming no immigration or emigration occurs. This is why the 2.1 rate is known as ‘the replacement rate’. Baby girls tend to be slightly outnumbered by baby boys, and some women of childbearing age do not live all the years to the age of 15-49.
This means that if the fertility rate falls below 2.1, the generations of women of childbearing age, and thus also the number of children in the upcoming generations, decrease. The only way to compensate for this is through immigration of people from abroad as this may increase the number of women of childbearing age.