GDP and main figures
24. Feb 2021
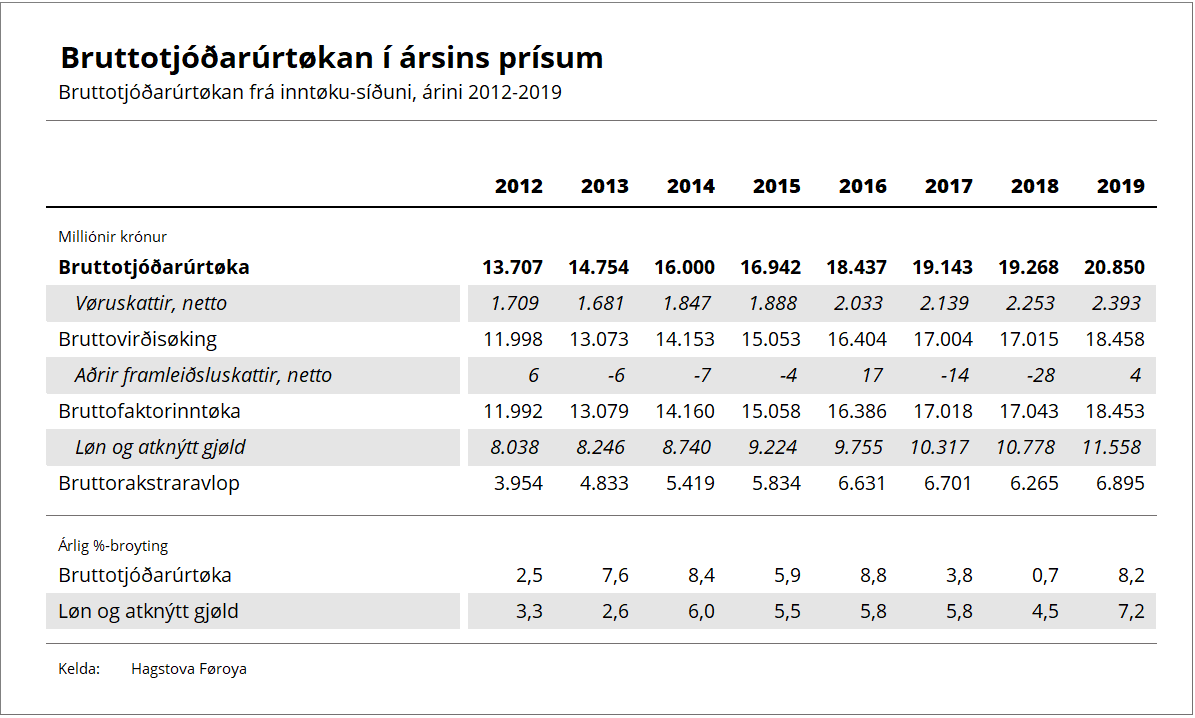
GDP at current prices increased by 8.2% in 2019

GDP at market prices is calculated as the total gross value added (GVA) across all industries plus VAT and taxes on products. The table below shows the GVA at current prices by industrial sector from 2016 to 2019.
More than half of the growth in GVA in 2019 came from industries within the primary sector. These industries saw a total GVA of DKK 5.1 billion, which is approx. 28% of the total GVA. This is an increase of DKK 799 million on the 2018 figure. 2018 was an unusual year for these industries as the GVA was almost DKK 500 million less than the previous year. This decrease was mainly due to a combination of lower prices and volumes of exported salmon, in addition to higher expenses incurred by the steadily growing problem with salmon lice in 2017 and 2018.
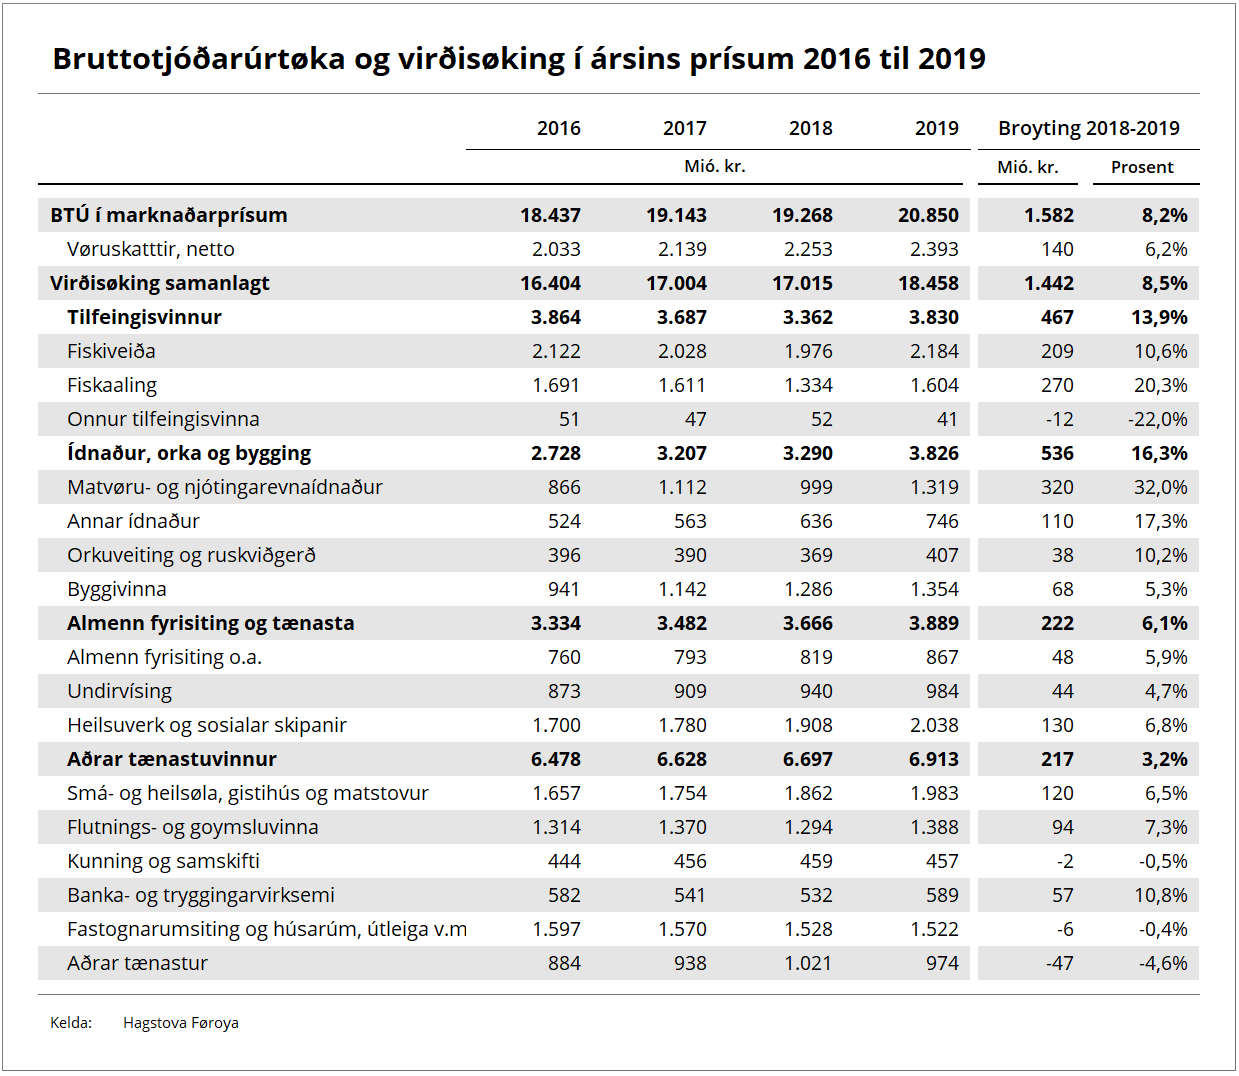
In the ‘other industries’ sector, which includes shipyards and miscellaneous manufactures of metal, packaging and other equipment for e.g. fishing and aquaculture, the GVA has also seen a relatively high increase in recent years. In 2019, the GVA growth in this industrial sector was DKK 110 million (17%) compared to 2018. In the construction industry, the year-on-year growth for 2019 was 5.3%, which is well below the average growth of approx. 14% in the 2013 to 2018 period. In 2019, the GVA growth in public administration and services was DKK 222 million (6.1%), which is the highest growth since the financial crisis. Other service industries saw a GVA growth of 3.2% in 2019. This growth predominantly came from retail and wholesale, hotels and restaurants, and transport and storage activities.
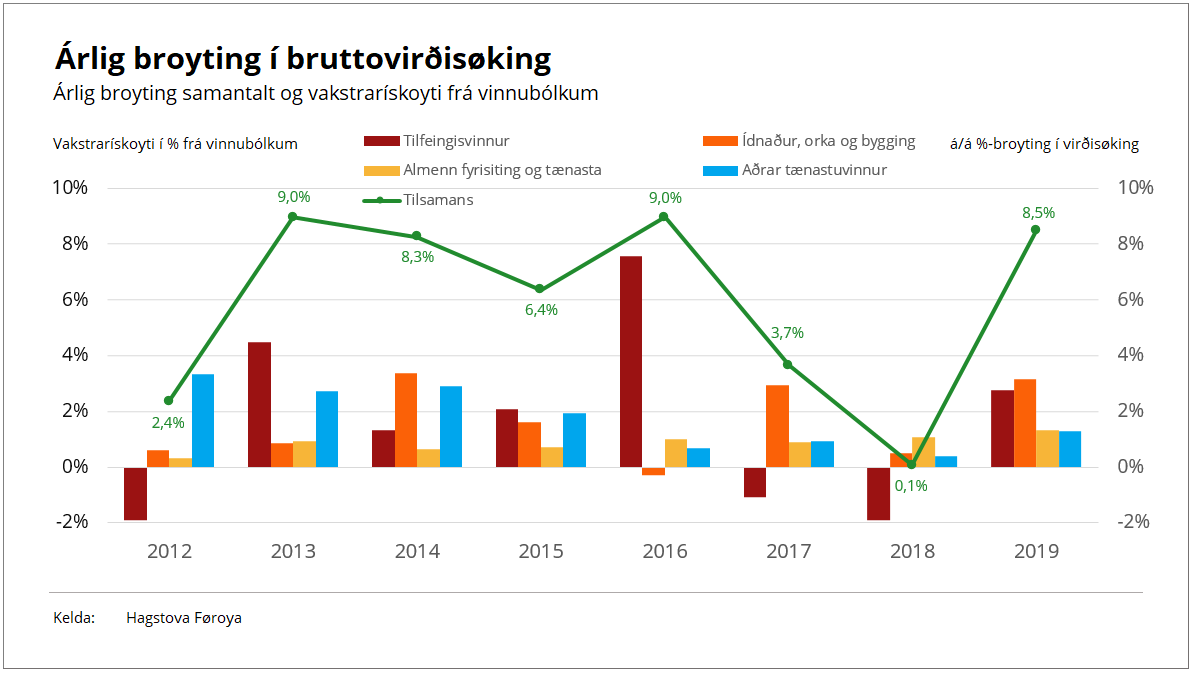
The graph below shows the distribution of the GVA for these main industrial sectors in the period 2012-2018. The graph illustrates the effect that various fluctuations in the primary industries in particular have on the total annual GVA change.