Consumer price index
19. Oct 2022
Highest inflation in 40 years

The Consumer Price Index (CPI) measures inflation as experienced by consumers in their daily living expenses.
[px-graph-1]
Price hikes across all goods and services categories
The Consumer Price Index (CPI) consists of 12 main categories of goods and services. The effect of each category on the overall price index is weighted according to consumption levels.
The latest figures, up to and including August 2022, reveal price hikes across all categories of goods and services. Prices in ‘food and non-alcoholic beverages’, the category that constitutes the largest portion of household consumption, went up by 10% year-on-year. The lowest price increase was in ‘health’ and ‘alcohol and tobacco’.
[px-graph-2]
Rising food prices have the greatest overall effect on the CPI
Higher food prices are the main reason for the overall CPI increase in the latest figures. Food prices have risen by almost 4% since the May 2022 quarterly CPI report. This represents a year-on-year increase of more than 10%.
[px-graph-3]
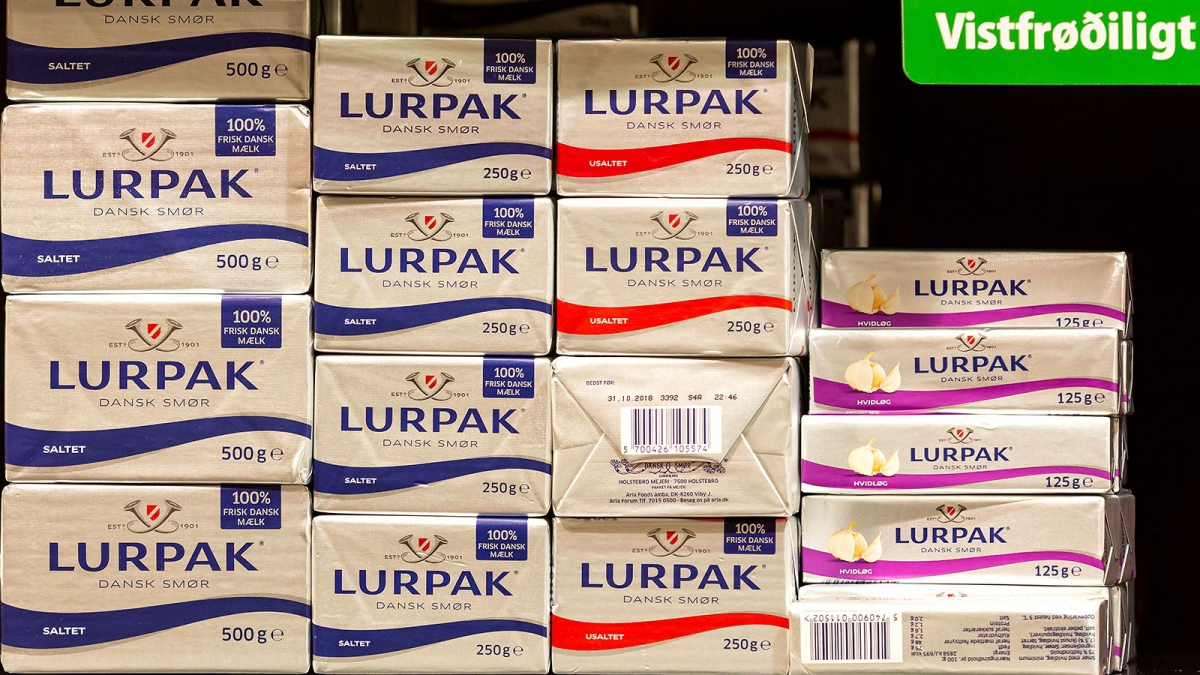
Within the food category, butter, margarine and cooking oil have seen the highest price hikes, going up by 25%. Prices of milk, cheese and eggs have gone up by 15%. Prices of bread and corn products, fruits, vegetables and meats have also risen significantly.
[px-graph-4]
Just about all food categories have seen higher prices in the past year, but prices of sugar and candy have had a modest increase of 3.7%. In other words, it has become relatively cheaper for households to purchase sweets than fruits and vegetables in the past year.
Housing prices up by almost 20%
Although prices in the ‘housing’ category have risen by almost 20% in the past year, the increase since the last report in May is less than 1%. This means that the highest increase in this category came in the previous quarter.
[px-graph-7]
‘Housing’ has the second-highest weighting of the 12 commodity groups in the representative basket of goods and services that reflects consumer buying patterns, making up about a fifth of the total household consumption. Rent and fuels for household heating make up the bulk of housing expenses.
Fuel prices almost unchanged since May
The significant price increase in fuel for household heating and vehicles in the past year continues to affect the annual CPI changes. However, average fuel prices have not increased since the last CPI report in May. Rising fuel prices were the biggest contributor to the annual CPI rate in the two previous quarterly reports.
[px-graph-5]
The annual price increase of fuel for vehicles is roughly the same as the average price increase in Denmark and Iceland.
Inflation rate similar to other Nordic countries
Faroese CPI figures are compiled quarterly, in February, May, August and November. This allows for comparisons with the CPI figures of other nations.
Inflation rates slowed down at the start of the pandemic in 2020, but they started accelerating in most countries in 2021. Since Russia’s full-scale invasion of Ukraine, inflation has reached record highs in the Faroes and elsewhere in Europe. The 8.8% inflation rate in the Faroes is at a similar level as in the other Nordic countries.
[px-graph-6]
In August, Denmark’s inflation rate was 8.9%. In Iceland and Sweden, it was 9.7% and 9.8%, respectively. Norway’s inflation rate was 6.5%, which is some way below the other Nordics and Europe in general. The HICP index (the Harmonised Indices of Consumer Prices) for the EU countries was 10.1% in August.