Labour force, survey
06. Dec 2024
Labour force: from agricultural to service society

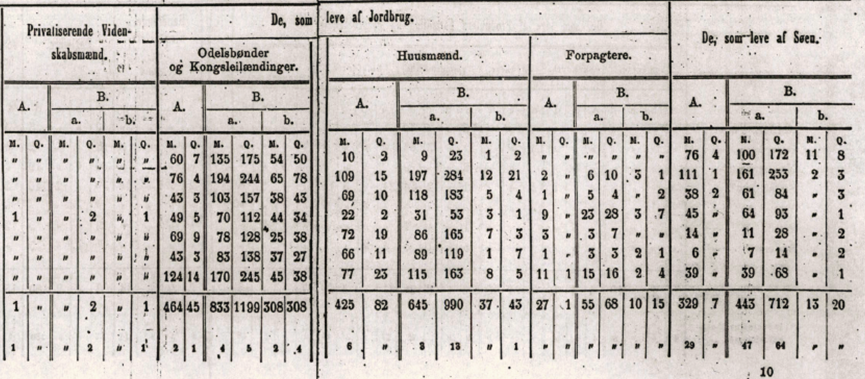
Historical statistics on the labour force are based on censuses conducted in the Faroe Islands between 1834 and 1977. Many of the censuses carried out in the Faroe Islands contain data on industries, sex, age and other labour force characteristics.
The historical figures are processed and classified in accordance with the international provisions of the International Labor Organization (ILO) under the United Nations.
According to the ILO, a person in the labour force is: “a person who produces or wishes to produce goods or services as described in the United Nations System of National Accounts (SNA)”. This means that the person produces or wishes to produce products for personal use (e.g. farmers) or works or wants to work for a wage or for profit.
The historical labour force statistics contain minor deviations from this definition.
In accordance with the international standard, the labour force is divided into employed and unemployed individuals. Unemployed people are included in the labour force because they are capable of providing labour. A person who is neither active nor unemployed is not included in the labour force. Since the censuses do not contain any records of unemployment, unemployed people are not included in the labour force in the historical figures.
In many historical censuses, civil servants were not classified as a separate group within the labour force but were instead grouped alongside individuals not considered part of the workforce. To enable comparisons between the years, civil servants are left out of the labour force in all censuses, including those where they are classified as a separate group.
In this report, the statistical group consists of those aged 15 and above, residing in the Faroe Islands. The ILO age definition for children is set as below 15 years, even though many children were historically able to support their families and were thus occupationally active.
It should also be noted that health and care work in the household, including the upbringing of children and the care of the elderly, does not count as economic services for personal use under this definition. Since this type of work has historically been predominantly associated with women, a large proportion of women are, according to the above definition, not listed as being part of the labour force.

From agriculture to service
When the censuses were conducted, details were recorded about people’s occupation or in which industry the person was active. Due to changes in occupational and economic activity classifications across censuses, direct comparisons are difficult. To facilitate comparisons, occupations and activities have been grouped into three overarching main sectors.
These main sectors are the primary sector, the manufacturing sector and the service sector. The primary sector is divided into agriculture and fisheries. Manufacturing includes crafts and industry. The service sector includes teachers, doctors, vicars and retail workers. Unspecified jobs and industries are classified separately.
In 1834, just under 80% of the labour force worked in agriculture. A majority of the population worked in agriculture up until 1890, when a shift occurred in which the bulk of the labour force moved from agriculture to the fishing industry. In 1911, 60% of the labour force worked in the fishing industry. Both of these industries are within the primary sector. The 1930s saw significant growth in the manufacturing sector, and by the end of World War II, manufacturing made up one-third of the total labour force. According to censuses, however, manufacturing never became the largest sector, as was the case in many other countries. This distinction went to the service sector, which gathered pace around this same time. By 1977, almost half of the labour force worked in the service sector.
[px-graph-1]
Since 1985, employees have been registered on monthly basis. These figures show continued growth in the service sector. If we look at the employees in the labour force and group them into the same overarching sectors, we see that more than 70% currently work in the service sector, 20% in manufacturing and just under 10% in the fishing industry. Agriculture accounts for a mere 0.2%.
[px-graph-2]
Women enter the labour force
The growth in the labour force kept pace with the population growth for many years. However, after 1945 there was a significant increase of women in the labour force. Most women at the time worked in the service sector, predominantly within health and care.
[px-graph-3]
Almost all men employed
The international term “employment rate” (employed people as % of the population) is used to describe the proportion of the working-age population that is occupationally active.
In 1921, almost all the men were employed. Over the next 50 years, this figure dropped to 82%, which is about the same as today. Women's labour force participation rate has historically been much lower – at a mere 11% percent in 1945. By 1977, it had tripled to 33%. Today, the proportion of occupationally active women is much higher and is also above 80%.
For comparisons with present-day figures, see the annual figures dating back to 2005 in the statbank.
[px-graph-4]
About historical labour force statistics
The first of many censuses in the Faroes took place in 1801. Some census records include labour force data while others do not. This report is based on those census records that include labour force data. Censuses were conducted by Statistics Denmark. Original documents are stored in the Danish National Archives.