Retail trade index
09. Jan 2023
Sales volume of food and non-alcoholic beverages drops 9%

Retail sales figures (listed here in nominal values converted to real values) are divided into the following three main commodity groups: ‘food and non-alcoholic drinks’, ‘clothing and footwear’ and ‘furnishings and household equipment’.
Statistics Faroe Islands recently reported on an 8.8% inflation rate from Q3 2021 to Q3 2022, which was the highest annual inflation rate in 40 years. Inflation tends to have a significant impact on the public’s purchasing power, and the Faroes are no exception.
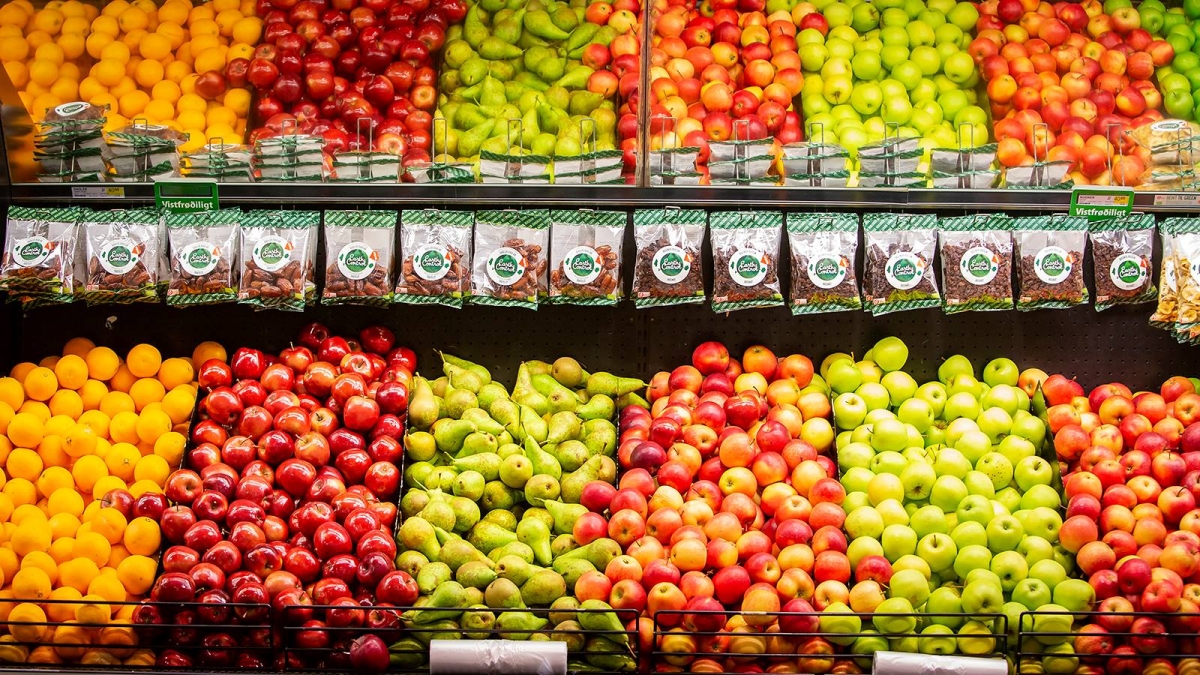
Retail prices in the ‘food and non-alcoholic drinks’ category increased by 10% from Q3 2021 to Q3 2022. Measured in current prices, retail sales in Q3 2022 were at a similar level as in Q3 2021. However, the sales volume has dropped significantly across all three main retail sales categories. Food and non-alcoholic beverages saw a 9% drop in sales volume.
[px-graph-1]
Retail prices in the furnishings and household equipment category increased by 11% year-on-year, and the sales volume dropped by 13%.
[px-graph-2]
Sales in the clothing and footwear category have also been affected by higher prices. Prices increased by 6% year-on-year, leading to a 15% decline in sales volume.
[px-graph-3]
Definitions:
-
Nominal prices are the current monetary values of goods in the period measured.
-
Seasonally adjusted figures are adjusted for seasonal patterns such as recurring seasonal activity patterns. Seasonal adjustment may not be a reliable method in periods with exceptional seasonal fluctuations where monthly figures deviate too much from the regular calendar.
-
Fixed prices means that the figures are adjusted for price inflation. Using fixed prices may provide reliable measures of the volume of sold goods and services.
-
The trend describes the trend in the measured figures, adjusted for seasonal effects and error components.
-
Indices show the year-to-year percentage change, with a base year set at 100. The difference between two years is measured in percentage points. Comparisons with the base year are made in percentages.