Economic sentiment indicator
04. Feb 2025
Business confidence hints at recovery
The Economic Sentiment Indicator (ESI) provides a snapshot of economic optimism by combining survey responses from consumers and businesses. Consumers contribute 20% to the overall index. The remaining 80% comes from four key industrial sectors, each weighted according to their economic contribution: primary sector (40%), services (30%), retail (5%) and construction (5%).
[px-graph-1]
The ESI currently stands at 9, which is below the long-term average of 15. The table below shows various confidence trends, with details for each six-monthly survey since January 2023.
[px-graph-2]
Households less optimistic about the year ahead
The confidence indicator for households, or consumers, is -12, indicating less confidence in the overall economic outlook than in the past two years. However, households are slightly more optimistic about their private finances 12 months from now, compared to today.
[px-graph-3]
More than a quarter struggle to make ends meet
Some 28% of households say they only just manage to make ends meet. Three years ago, this figure was 23%. About 55% of households are saving, though mostly small amounts, while 5% report saving substantial amounts. Despite significant consumer price hikes in recent years, borrowing does not appear to have increased. 8% report using their savings.
[px-graph-4]
Will consumer spending increase?
Consumer patterns affect the retail sector, as Faroese households purchase a large portion of the goods offered by this sector. More consumers are reporting that now is the right time for major purchases such as furniture and electronic items. More consumers also plan to spend substantial amounts on home improvements, compared with the previous survey from June 2024.
[px-graph-5]
Consumers rarely believe there is an ideal time to buy a car, though this sentiment is on a slight increase.
Survey questions and graphs are available on the consumer page.
Growing confidence for retailers
Brighter days may be ahead for the retail sector. The retail confidence indicator has increased from 4 to 13, and consumer price growth is slower than it has been in the past three years. This positive momentum is reflected in retailers' expectations: they anticipate increased sales in the coming year, report better sales in the past year compared with the previous two surveys and expect an increased demand for staff in the next 12 months.
[px-graph-6]
Survey questions and graphs are available on the retail trade page.
Construction confidence fading
Construction confidence fell from 31 to 16, dipping below the long-term average of 23. The construction sector's vulnerability to the economic cycle is evident in the major fluctuations seen in the graph below.
[px-graph-7]
Construction firms have seen a decrease in orders and project a decline in staff demand over the next 12 months.
[px-graph-8]
In this latest ESI report, 30% of construction firms cited poor weather as a factor limiting production. 16% reported having no constraints, while 27% say they have financial constraints.
Survey questions and graphs are available on the construction page.
Less pessimism in primary sector and industries
The industrial confidence indicator rose from -33 to -3. Firms in the primary sector and industry are expecting an increase in production in the year ahead. The firms also expect higher selling prices. The anticipated increase in production is believed to be linked to an increase in orders and declining inventories. Increased activity in the primary sector is reflected in the demand for staff.
[px-graph-9]
The Faroese primary sector is affected by global economic cycles as it is heavily reliant on exports. There has been a notable increase in orders from abroad, and firms report an improvement in international market share.
Service optimism on the rise
The service sector has seen improvements over the past year, with surveyed companies reporting satisfactory turnover. This increasing optimism is reflected in an anticipated increase in staff demand over the next year.
[px-graph-10]
Survey questions and graphs are available on the primary-sectors page and services page.
About the tendency survey
The economic tendency survey consists of indicators that measure economic optimism among consumers and businesses. The major element of this survey is the economic sentiment indicator (ESI), a composite indicator compiled twice a year (January and June) that calculates the confidence that consumers and the main four industrial sectors have in the economy.
Rather than reflecting a direct measure of economic activity, the ESI, a weighted index from five questionnaires, represents the difference between the percentages of respondents giving positive and negative replies about their current and projected economic outlook.
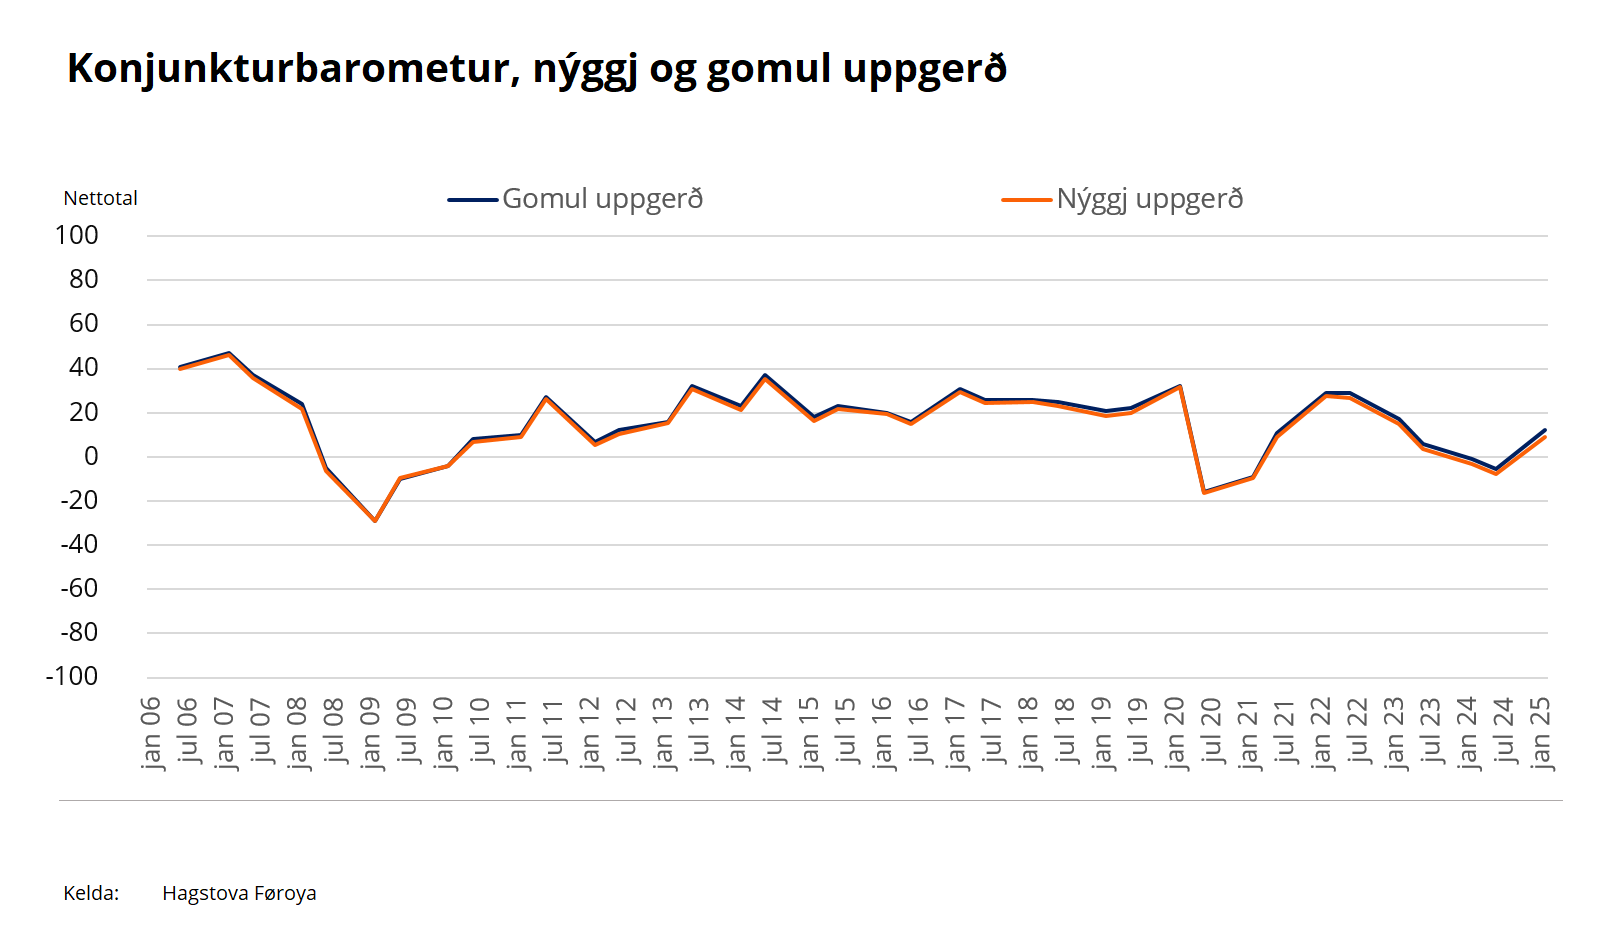
Revised survey methodology
Following updated guidance on business cycle barometers in 2024, this latest ESI report incorporates revised survey questions and methodologies, now aligned with those used in all ECFIN member states. These revisions facilitate international comparisons.
The index for the consumer survey is calculated as the average of the net scores in the following four questions:
- How has your household's financial situation changed over the past 12 months?
- How do you expect your household's financial situation to change in the next 12 months?
- How do you think the Faroese economy will fare over the next 12 months?
- Do you expect your household to make more major purchases (such as furniture or electronic items) in the next 12 months than in the previous 12 months?
The graph below shows how methodological revisions affect the data retrospectively.