
Population
10. Mar 2025
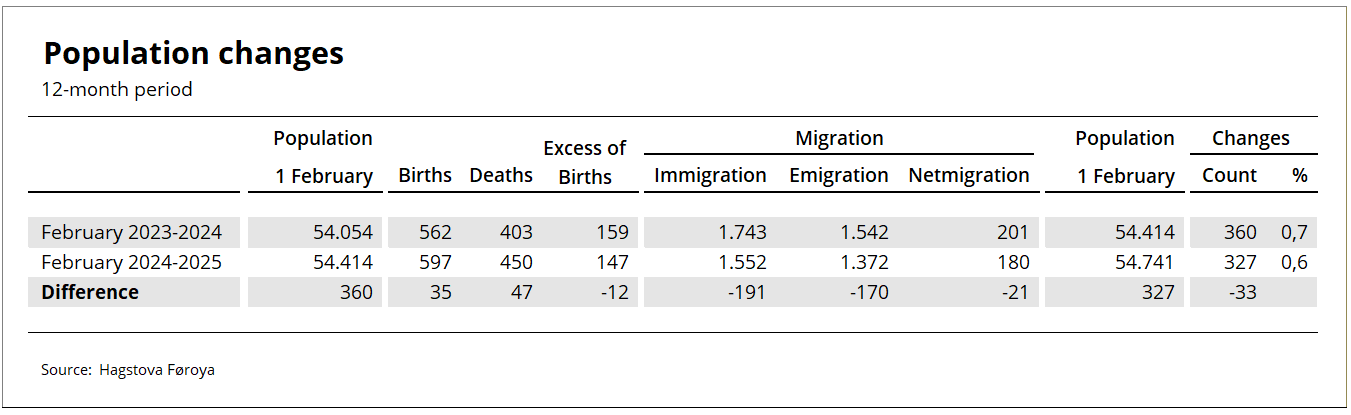
Population was 54,741 on 1 February — up 0.6% year-on-year
The population growth that began accelerating in 2014 peaked in summer 2019 when the population increased by 900 people (1.8%) during a 12-month period. The population growth has since declined steadily to about one-third of this figure, reaching 0.6% in February 2025.
[px-graph-1]
Excess of births and net migration dropping
The population trend is determined by net migration, i.e. the difference between the number of immigrants and the number of emigrants, and the excess of live births over deaths.
The population growth in the past year was driven by an excess of births of 147 people and a net migration figure of 180 people. This corresponds to an excess of births figure of 2.7 births per 1,000 population and a net migration figure of 3.3 people per 1,000 population. Both these figures are down from the 1 February 2023 - 1 February 2024 period, when the excess of births was at 2.9 and net migration at 3.7 per 1,000 population.
See more figures in the table below.
Less migration
The graph below shows the monthly trends for immigration and emigration. Note that trends for the past six months should be interpreted with caution due to incomplete data.
The graph shows that both immigration and emigration have displayed a monthly declining trend and indicates that this decline is continuing.
[px-graph-2]
More births and deaths
The graph below illustrates monthly trends in births and deaths. Note that trends for the past six months should be interpreted with caution due to incomplete data.
The birth rate trend indicates that the steadily decreasing trend is about to turn into an increase. There are also indications that the death rate trend is reversing.
[px-graph-3]
Population by municipality
The table below shows the population across the 29 municipalities, with details for each town and village on 1 February 2024 and 1 February 2025.
In municipalities with more than 1,000 residents, the highest relative growth was in Sjóvar and Nes municipalities. The biggest relative decline was in Vágur and Sunda municipalities.
In municipalities with between 500 and 1,000 residents, Kvívík saw the highest relative population growth, while Sandur experienced the biggest relative decline.
In municipalities with fewer than 500 residents, Skálavík and Fugloy had the highest relative growth, increasing year-on-year by 16% and 19%, respectively.
[px-graph-4]
Population by municipality
The table below shows the population across the 29 municipalities, with details for each town and village on 1 February 2024 and 1 February 2025.
In municipalities with more than 1,000 residents, the highest relative growth was in Sjóvar and Nes municipalities. The biggest relative decline was in Vágur and Sunda municipalities.
In municipalities with between 500 and 1,000 residents, Kvívík saw the highest relative population growth, while Sandur experienced the biggest relative decline.
In municipalities with fewer than 500 residents, Skálavík and Fugloy had the highest relative growth, increasing year-on-year by 16% and 19%, respectively.
Population figures have a one-month lag
The figures have a one-month lag due to delays in registrations, especially regarding address changes, where many registrations are made after the month of address change has ended. To accommodate as many corrections as possible, there is a one-month lag in the data.
About the population figures
The population is defined as all individuals registered in the national register as residents of the Faroe Islands. Population data includes date of birth, gender, place of birth, citizenship, relationship status, and, where applicable, information on immigration and emigration, domestically as well as between the Faroe Islands and other nations.
About the trend
The trend describes the population trend by adjusting for seasonal effects and other error components in the population figure.