
Population
12. May 2025
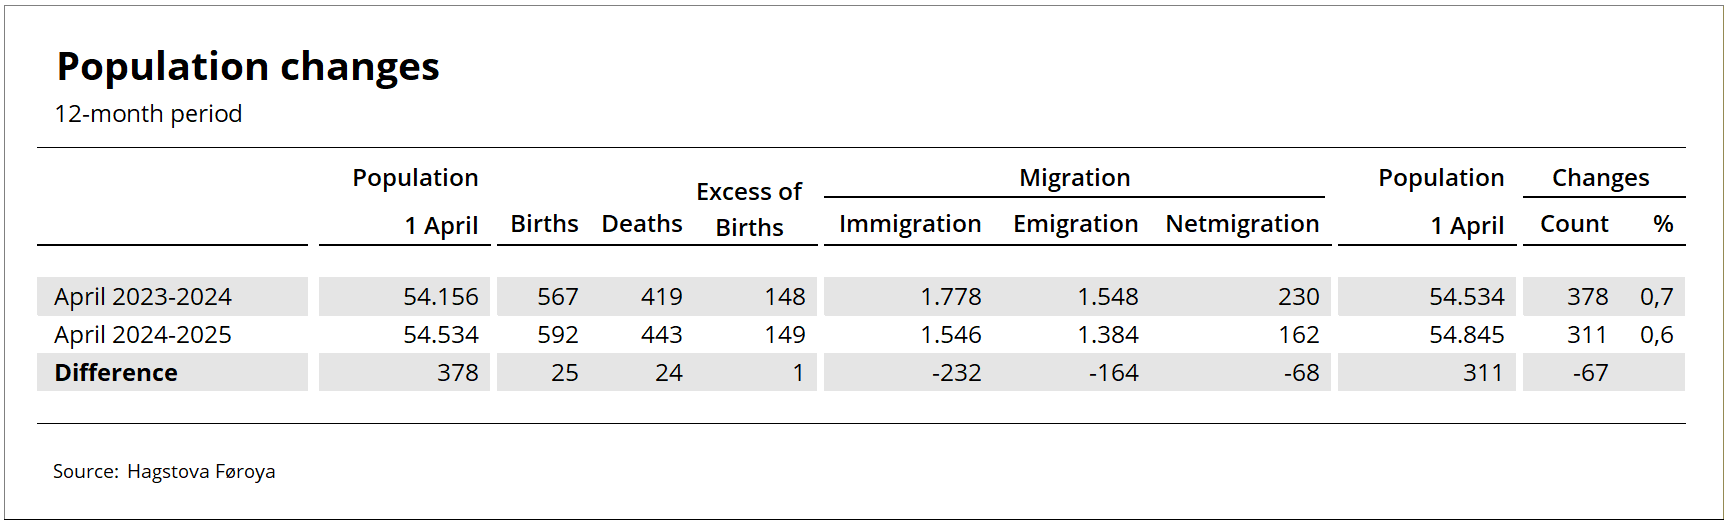
Population was 54,845 on 1 April — up 0.6% year-on-year
The population growth that began accelerating in 2014 peaked in summer 2019 when the population increased by about 900 people (1.8%) over a 12-month period. This growth has since declined steadily to about one-third of this figure, reaching 0.6% in April 2025. The excess of births over deaths and net migration each accounted for about half of the population growth in the past year.
[px-graph-1]
Excess of births unchanged, net migration falling
The population trend is determined by net migration, i.e. the difference between the number of immigrants and the number of emigrants, and the excess of live births over deaths.
The population growth in the past year was driven by an excess of births of 149 people and a net migration figure of 162 people. The change from the previous year is due to net migration, as the decrease in immigration outpaced the decrease in emigration.
This corresponds to an excess of births figure of 2.7 births per 1,000 population and a net migration figure of 3.0 people per 1,000 population. For comparison, the 1 April 2023 - 1 April 2024 period saw the same figure for the excess of births and a net migration figure of 4.2 per 1,000 population.
See more figures in the table below
Less migration
The graph below shows the monthly trends for immigration and emigration. Note that trends for the past six months should be interpreted with caution due to incomplete data.
The migration data indicates a smaller decrease in immigration, while the declining trend for emigration continues.
[px-graph-2]
More births
The graph below illustrates monthly trends in births and deaths. Note that trends for the past six months should be interpreted with caution due to incomplete data.
The trend for birth rates indicates that the steadily decreasing trend dating back to 2020 is now reversing. The death rate trend is more stable.
[px-graph-3]
Population by municipality
The municipalities with the highest population growth were Tórshavn, Nes, Sjóvar and Skálavík. The towns and villages within these municipalities with the biggest growth were Tórshavn, Strendur, Toftir, Artir and Skálavík. Other towns and villages with population growth in the past year were Saltangará, Hvannasund, Leirvík, Sørvágur, Streymnes and Klaksvík.
The biggest population decline was registered in Vágur, Tvøroyri and Viðareiði municipalities. Within these municipalities, Vágur, Froðba and Viðareiði had the biggest decline.
The table below shows the population by municipalities, with details for each town and village on 1 April 2024 and 1 April 2025
[px-graph-4]
Population figures have a one-month lag
The figures have a one-month lag due to delays in registrations, especially regarding address changes, where many registrations are made after the month of address change has ended. To accommodate as many corrections as possible, there is a one-month lag in the data.
About the population figures
The population is defined as all individuals registered in the national register as residents of the Faroe Islands. Population data includes date of birth, gender, place of birth, citizenship, relationship status, and, where applicable, information on immigration and emigration, domestically as well as between the Faroe Islands and other nations.
About the trend
The trend describes the population trend by adjusting for seasonal effects and other error components in the population figure.