
Population
10. Jun 2025
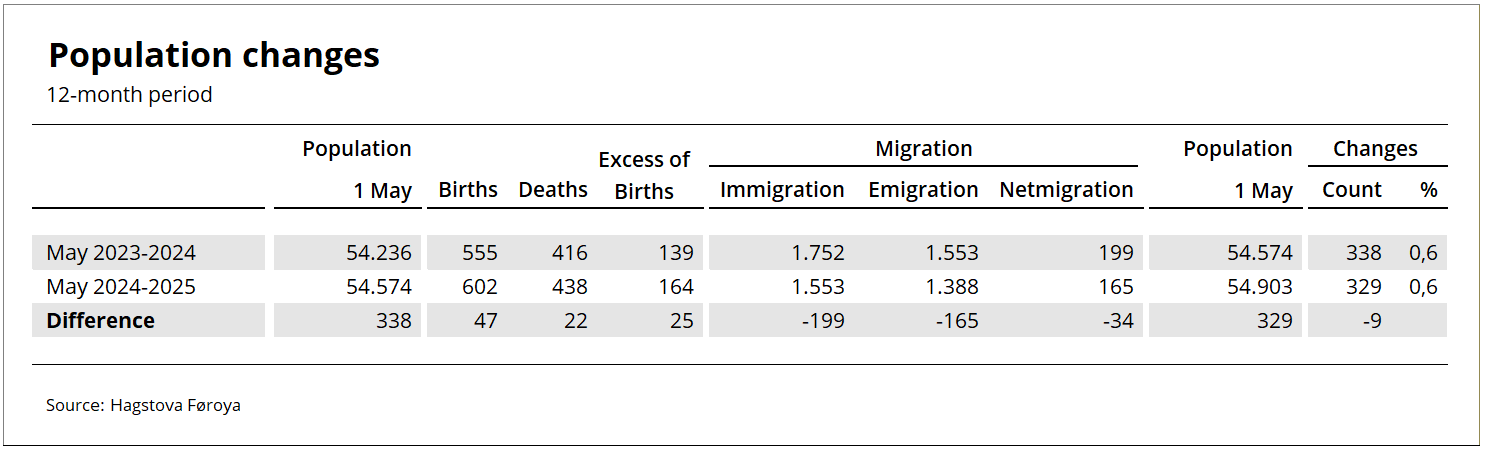
Population was 54,903 on 1 May — up 0.6% year-on-year

The population growth that began accelerating in 2014 peaked in summer 2019 when the population increased by about 900 people (1.8%) over a 12-month period. This growth has since declined steadily to about one-third of this figure, reaching 329 people (0.6%) in May 2025. The excess of births over deaths and net migration each accounted for about half of the population growth in the past year.
[px-graph-1]
Excess of births rising, net migration falling
The population trend is determined by net migration, i.e. the difference between the number of immigrants and the number of emigrants, and the excess of live births over deaths.
The population growth in the past year was driven by an excess of births of 164 people and a net migration figure of 165 people. This corresponds to an excess of births figure of 3.0 births per 1,000 population and a net migration figure of 3.0 people per 1,000 population.
The excess of births was higher than in the previous 12-month period because although there were more deaths, there were even more live births.
Net migration fell slightly compared to the previous year as the decrease in immigration outpaced the decrease in emigration.
For comparison, the 1 May 2023 - 1 May 2024 period saw a 2.6 figure for the excess of births and a net migration figure of 3.7 per 1,000 population.
See more figures in the table below.
Less migration
The graph below shows the monthly trends for immigration and emigration. Note that trends for the past six months should be interpreted with caution due to incomplete data.
The monthly migration trend indicates that the declining trend in immigration is continuing, while the emigration trend is also falling, but at a slower pace.
[px-graph-2]
Steadier figures for births and deaths
The graph below illustrates monthly trends in births and deaths. Note that trends for the past six months should be interpreted with caution due to incomplete data.
The monthly trend indicates that the trend in birth and death figures, which has been steadily rising in the past 18 months, is flattening out.
[px-graph-3]
Population by municipality
The table below shows the population across the 29 municipalities, with details for each town and village on 1 May 2024 and 1 May 2025.
The municipality with the highest population growth was Tórshavn, which contains more than 40% of the total Faroese population.
The second-highest population growth was registered in Nes municipality, whose population has now surpassed 1,600. The third-highest growth was in Sjóvar municipality, whose largest village, Strendur, has experienced substantial growth in recent years and now has a population of 1,100.
Fourth on the list was Skálavík municipality, which consists of just under 180 people. Skálavík saw an increase of 40 people in the past year, equivalent to a year-on-year increase of almost 30%. The last time Skálavík had a population of around 180 was in 2007.
The table below shows the population by municipalities, with details for each town and village on 1 May 2024 and 1 May 2025
[px-graph-4]
Population figures have a one-month lag
The figures have a one-month lag due to delays in registrations, especially regarding address changes, where many registrations are made after the month of address change has ended. To accommodate as many corrections as possible, there is a one-month lag in the data.
About the population figures
The population is defined as all individuals registered in the national register as residents of the Faroe Islands. Population data includes date of birth, gender, place of birth, citizenship, relationship status, and, where applicable, information on immigration and emigration, domestically as well as between the Faroe Islands and other nations.
About the trend
The trend describes the population trend by adjusting for seasonal effects and other error components in the population figure.