
Kommunal fíggjarviðurskifti
06. nov 2020
Municipal finances per capita in 2019

Costs and revenues for municipalities
The chart below lists each municipality in ascending order based on expenditures per capita in 2019.
In general, the larger municipalities have the highest expenditures per capita and the smallest have the lowest.
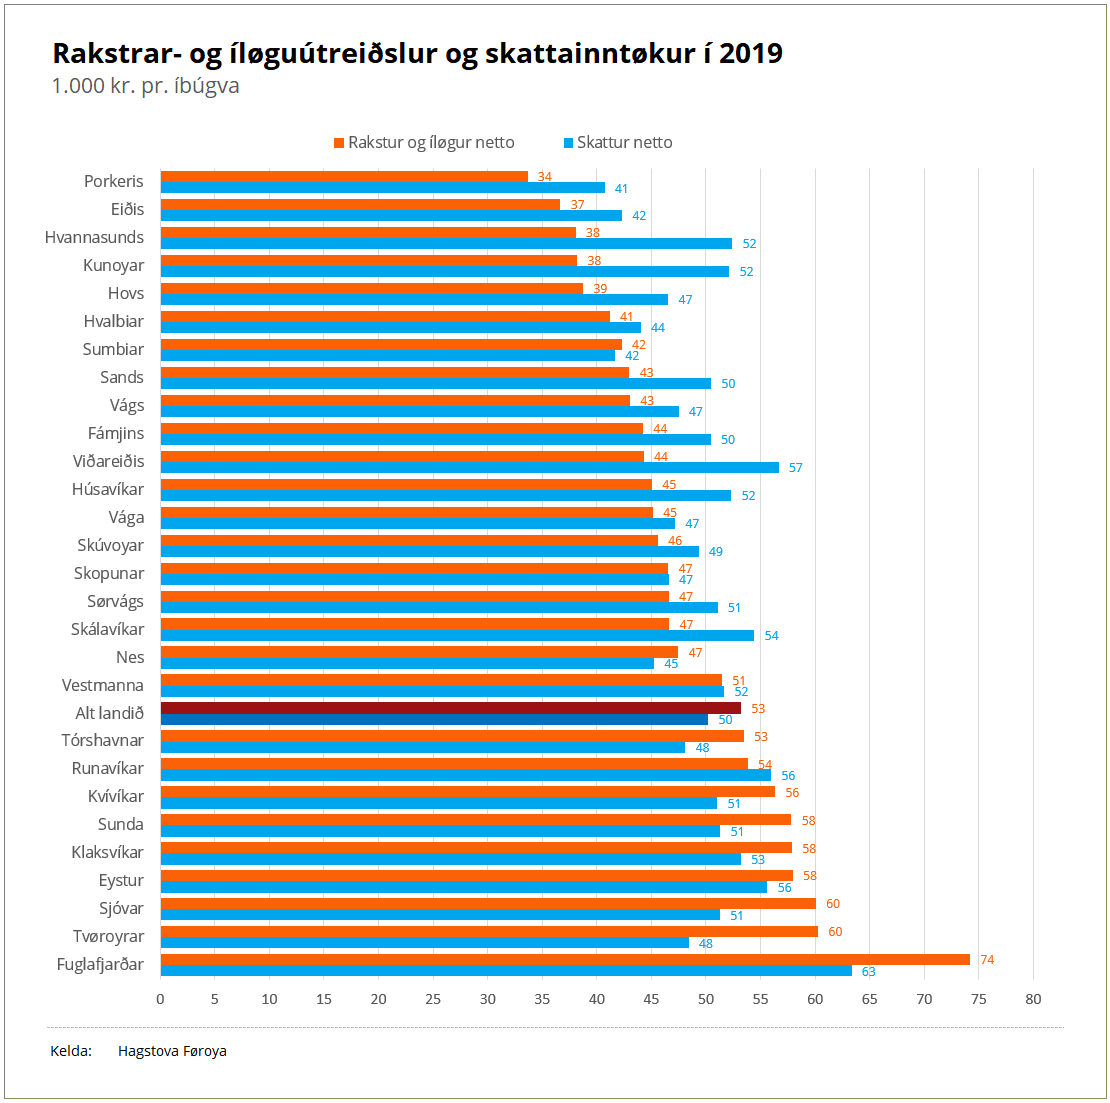
The small municipalities generally have the highest per capita difference between costs and revenues. Notable examples of this are Hvannasunds, Kunoyar and Viðareiðis municipalities.
At the other end of this spectrum are most of the larger municipalities, along with a few of the smaller ones, where costs exceed revenues – for example Fuglafjarðar, Tvøroyrar and Sjóvar municipalities.
The two largest municipalities – Tórshavnar and Klaksvíkar – had significantly higher costs than revenues, whereas in the third-largest municipality, Runavíkar, revenues exceeded the costs.
Fuglafjarðar stands out among the larger municipalities with significantly higher per capita expenditures and revenues than elsewhere in the country.
Net debt per capita
Some of the larger municipalities top the net debt per capita list. Vágs municipality has by far the highest net debt per capita, followed by Runavíkar, Tvøroyrar and Klaksvíkar.
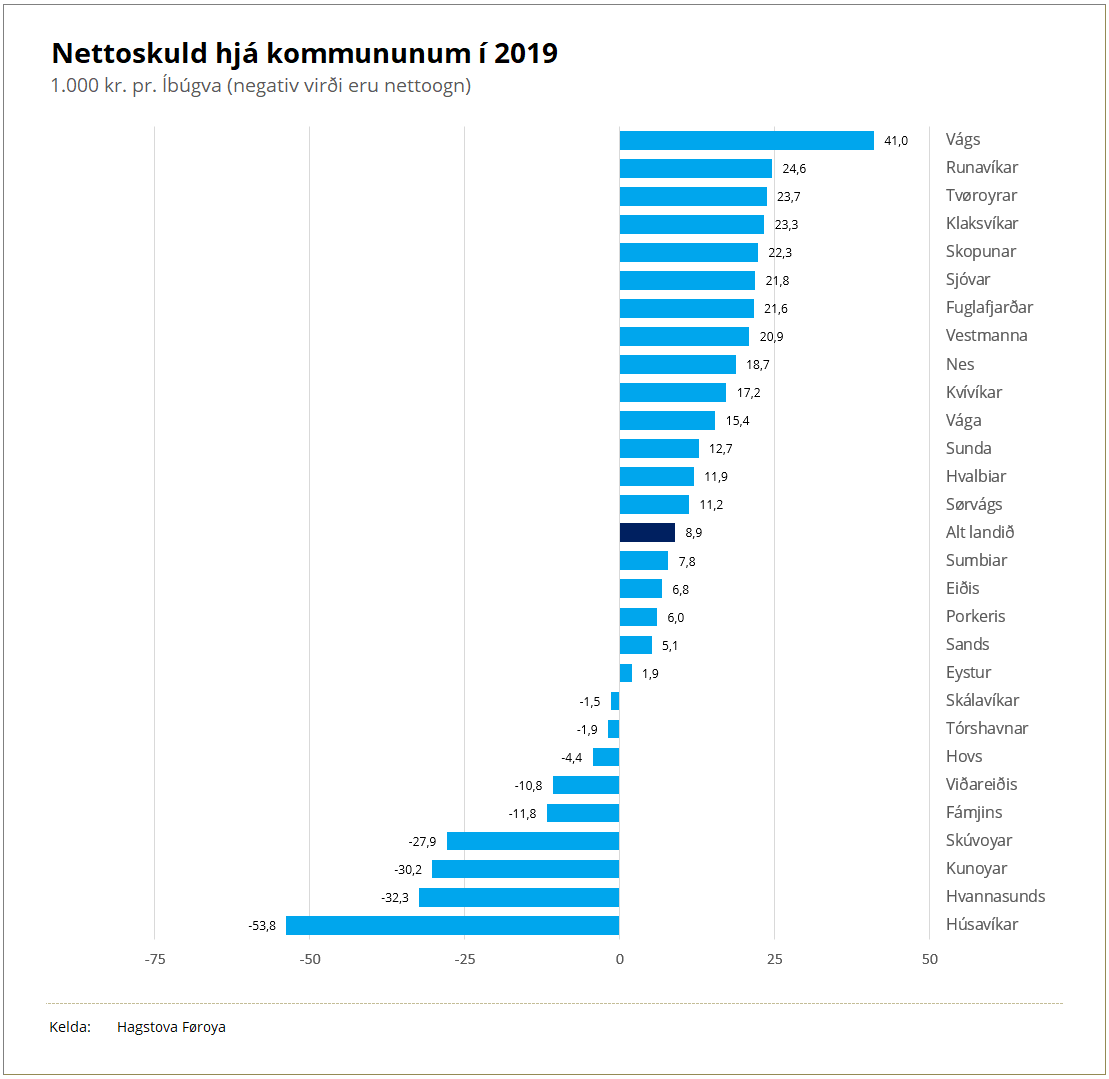
Out of the municipalities that are in the black – with net assets rather than debt – all, except the largest, Tórshavnar, are small municipalities.
Fugloyar municipality is not included, as the figures for 2018 and 2019 have not been finalised.